Get Certified for
Business Intelligence (BIDA®)
Develop analytical superpowers by learning how to use programming and data analytics tools such as VBA, Python, Tableau, Power BI, Power Query, and more.
A data modeling and analysis package for Microsoft Excel
Power Pivot[1] is a data modeling and analysis package built into Microsoft Excel. It brings some key business intelligence functionality into the heart of Excel, allowing users get to insights faster. This functionality includes data modeling, increased data capacity compared with Excel worksheets, and the DAX powerful formula language.
Power Pivot will transform an analyst’s ability to work with large amounts of related data, eliminating intensive lookup formulas and giving them a way to produce fast, repeatable analysis.
The current capacity of an Excel worksheet is just over a million rows. For model building and formulas, this isn’t usually a problem. But for analyzing large amounts of data, we can often end up with many millions of rows of data.
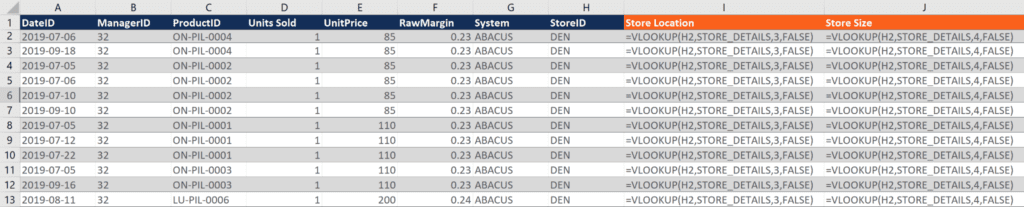
Traditionally, combining related data in Excel relies on formulas like VLOOKUP, INDEX & MATCH. When working with large data sets, this can result in tens of thousands of rows of formulas, with a new column required for every additional piece of information. Not only are these formulas resource-intensive every time Excel recalculates them, but they need to be maintained and free from errors.
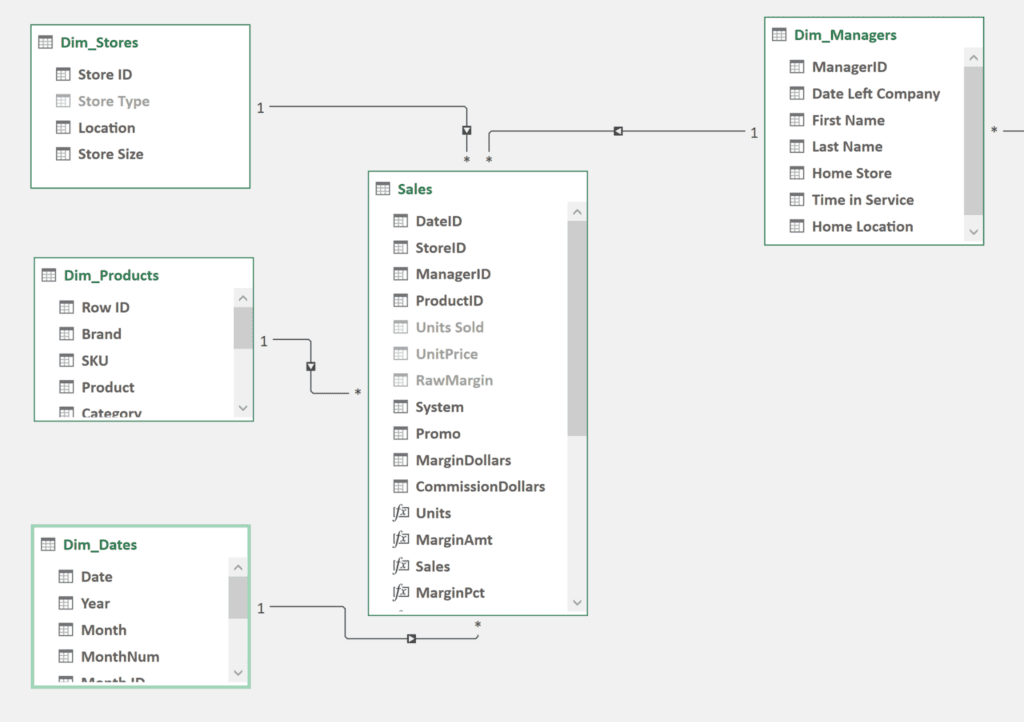
Instead, Power Pivot allows us to build simple relationships between tables of related data, creating what is known as a data model. By doing this, we can replace hundreds of thousands of formulas with a single relationship, making model maintenance exceptionally easy. Relationships are activated only when the related data is required, eliminating the constant recalculation of formulas.
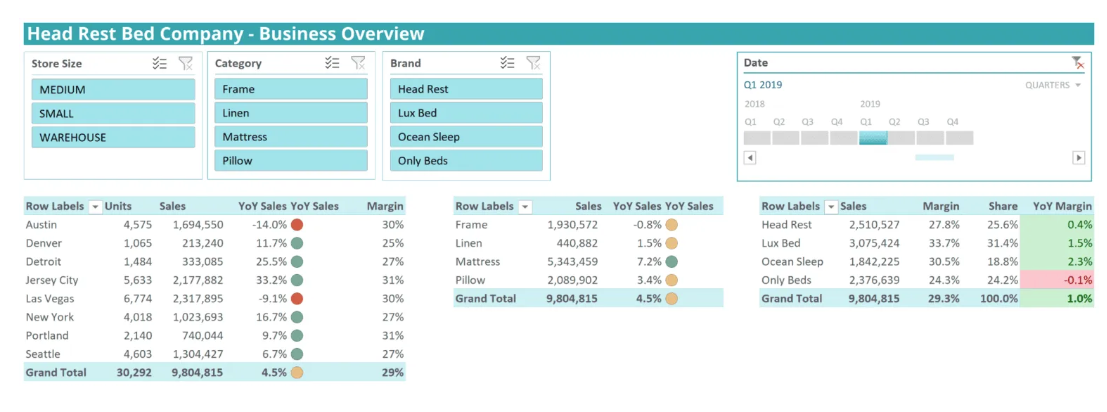
With a single connected data model of data, creating analysis, pivot tables and insights becomes easy. Data from all these connected tables can be used together in Pivot tables to slice and dice analysis by store, product, manager, or any other related attribute.
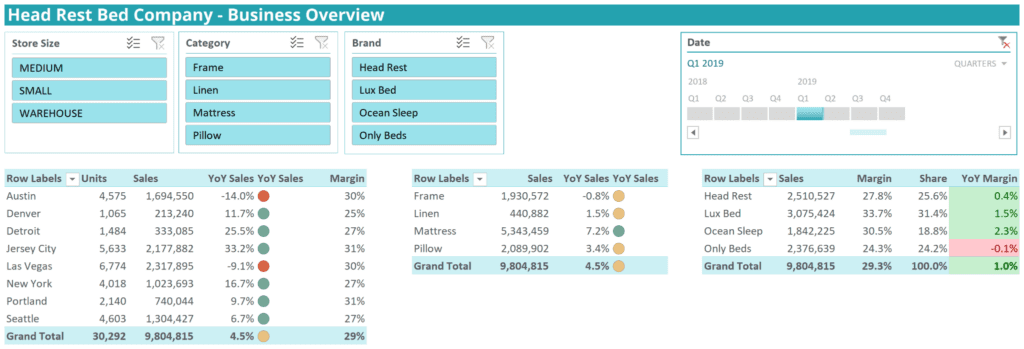
Power Pivot uses the DAX formula language to offer powerful formula manipulation. It is the same formula language used in Power BI. Using this, we can easily compare the percentage of total, difference to last year, or difference to a specific category.
Below is an example of time intelligence. We start with the basic definition of the [sales] metric, which is then modified to look at sales from the SAMEPERIODLASTYEAR.
![]()
In Excel, we often come across large, nested formulas which become hard to audit and maintain. In DAX, we can define variables to help us store intermediate values before continuing with our formula and finally returning a result.
While variations of this functionality exist in excel, for example, with the LET formula, DAX provides a much cleaner experience.

Anybody working in Excel will drastically improve their ability to work with and gain insights from data by working with Power Pivot. With the many benefits listed above, analysts will get to insights faster, with less intensive formulas and more auditable models.
Data models form the main part of the business intelligence process, bringing together related data ready for analysis. Power Pivot is a great stepping stone for any Excel-based analysts to start their journey into business intelligence. It provides transferable DAX formula knowledge into Power BI and uses the same data modeling techniques as other more advanced BI tools.

Power Pivot is available in Excel 2019, 2016, 2013, and 2010, as well as in Excel in Office 365. You may need to activate the add-in.
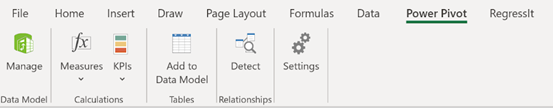
Power Pivot can be accessed via the Power Pivot tab in Excel. By clicking the lime green Manage button, you can access the data view and diagram view of your data model.
To master the art of Excel, check out CFI’s Excel Crash Course, which teaches you how to become an Excel power user. Learn the most important formulas, functions, and shortcuts to become confident in your financial analysis.

Launch CFI’s Excel Crash Course now to take your career to the next level and move up the ladder!


