Over 2 million + professionals use CFI to learn accounting, financial analysis, modeling and more. Unlock the essentials of corporate finance with our free resources and get an exclusive sneak peek at the first chapter of each course.
Start Free
What is the YIELD Function?
The YIELD Function[1] is categorized under Excel Financial functions. It will calculate the yield on a security that pays periodic interest. The function is generally used to calculate bond yield.
As a financial analyst, we often calculate the yield on a bond to determine the income that would be generated in a year. Yield is different from the rate of return, as the return is the gain already earned, while yield is the prospective return.
Settlement (required argument) – This is the settlement date of the security. It is a date after the security is traded to the buyer that is after the issue date.
Maturity (required argument) – This is the maturity date of the security. It is the date when the security expires.
Rate (required argument) – The annual coupon rate.
Pr (required argument) – The price of the security per $100 face value.
Redemption (required argument) – This is the redemption value per $100 face value.
Frequency (required argument) – The number of coupon payments per year. It must be one of the following: 1 – Annually, 2 – Semi-annually, 4 – Quarterly
[basis] (optional argument) – Specifies the financial day count basis that is used by the security. The possible values are:
Basis
Day Count basis
0 or omitted
US(NASD) 30/360
1
Actual/actual
2
Actual/360
3
Actual/365
4
European 30/360
The settlement and maturity dates should be supplied to the YIELD function as either:
References to cells containing dates
Dates returned from formulas.
How to use the YIELD Function in Excel?
As a worksheet function, YIELD can be entered as part of a formula in a cell of a worksheet. To understand the uses of the function, let’s consider an example:
Example
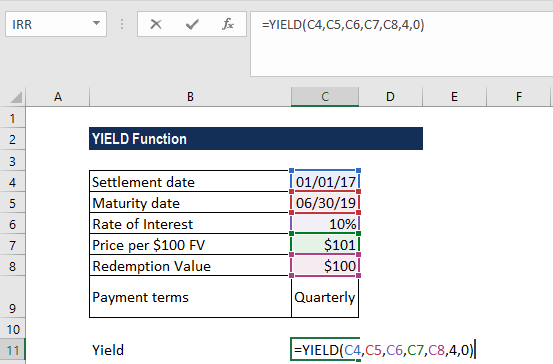
Suppose we are given the following data:
Settlement date: 01/01/2017
Maturity date: 6/30/2019
Rate of interest: 10%
Price per $100 FV: $101
Redemption value: $100
Payment terms: Quarterly
We can use the function to find out the yield. The formula to use will be:
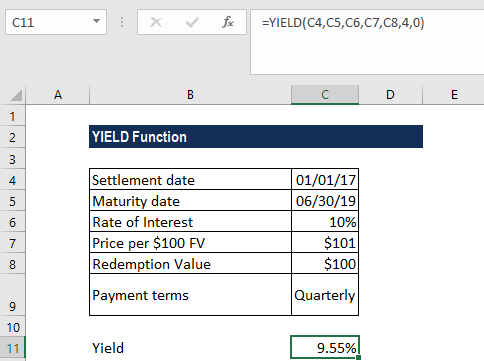
We get the result below:
In the above example:
We used as the basis the US (NASD) 30/360 day basis.
As recommended by Microsoft, the date arguments were entered as references to cells containing dates.
A few things to remember about the YIELD Function:
#NUM! error – Occurs when:
The settlement date provided is greater than or equal to the maturity date.
We provide invalid numbers for the rate, pr, redemption, frequency, or [basis] arguments. That is, if we provide rate < 0; pr ≤ 0; redemption ≤ 0; frequency is any number other than 1, 2, or 4; or [basis] is any number other than 0, 1, 2, 3, or 4.
#VALUE! error – Occurs when:
Any of the arguments provided is non-numeric.
The settlement and maturity dates provided are not valid dates.
The result from the Excel RATE function appears to be the value 0 or appears as a percentage but shows no decimal places. This problem is often due to the formatting of the cell containing the function. If this is the case, fix the problem by formatting the cell to show a percentage with decimal places.
The settlement date is the date a buyer purchases a security such as a bond. The maturity date is the date when a security matures/expires. For example, assume a 30-year bond is issued on January 1, 2010 and is purchased by a buyer six months later. The issue date would be January 1, 2010, the settlement date would be July 1, 2010, and the maturity date would be January 1, 2040, which is 30 years after the January 1, 2010 issue date.
Thanks for reading CFI’s guide to the Excel YIELD function. By taking the time to learn and master these functions, you’ll significantly speed up your financial modeling. To learn more, check out these additional CFI resources:
To master the art of Excel, check out CFI’s Excel Crash Course, which teaches you how to become an Excel power user. Learn the most important formulas, functions, and shortcuts to become confident in your financial analysis.
Take your learning and productivity to the next level with our Premium Templates.
Upgrading to a paid membership gives you access to our extensive collection of plug-and-play Templates designed to power your performance—as well as CFI's full course catalog and accredited Certification Programs.
Gain unlimited access to more than 250 productivity Templates, CFI's full course catalog and accredited Certification Programs, hundreds of resources, expert reviews and support, the chance to work with real-world finance and research tools, and more.