Get Certified for Financial Modeling (FMVA)®
Gain in-demand industry knowledge and hands-on practice that will help you stand out from the competition and become a world-class financial analyst.
The use of financial figures to gain significant information about a company
Get our free best practices guide for essential ratios in comprehensive financial analysis and business decision-making.
Financial ratios are calculations that compare two or more figures from a company’s financial statements to measure performance and financial health.
Analysts, investors, and managers use financial ratios to understand how well a company can meet debt obligations, generate profits, and use resources effectively. Ratios also make it easier to compare businesses of different sizes and track results over time.
The main categories of financial ratios are:
Analysts rarely rely on a single ratio. Instead, analysts use combinations of ratios to track a company’s performance trends, benchmark it against peers, and identify potential risks or strengths.

The main types of financial ratios are liquidity, leverage, efficiency, profitability, and market value. Analysts use these categories to evaluate short-term stability, long-term debt capacity, operational efficiency, earnings strength, and stock valuation.
The table below summarizes the five main categories of financial ratios, what each measures, and a common example used by analysts and investors.
| Liquidity Ratios | Current Ratio | Balance Sheet | Current Ratio = Current Assets / Current Liabilities | How well a company maximizes the liquidity of current assets to settle debt and obligations |
| Leverage Ratios | Debt to Equity Ratio | Balance Sheet | Debt to Equity = Total Debt / Shareholders’ Equity | How much a company relies on debt compared to equity financing |
| Efficiency Ratios | Asset Turnover Ratio | Balance Sheet & Income Statement | Asset Turnover = Net Sales / Average Total Assets | How well a company uses all assets to generate sales |
| Profitability Ratios | Operating Margin | Income Statement | Operating Margin = Operating Income / Net Sales | How much profit a company earns relative to sales |
| Market Value Ratios | Price to Earnings (P/E) Ratio | Income Statement & Current Share Price | P/E Ratio = Share Price / Earnings Per Share | How much investors are willing to pay for a company’s earnings |
Ready to dive deeper into financial ratios? CFI’s free Financial Ratios Definitive Guide covers 30+ essential ratios every financial analyst should know, from formulas to examples and detailed explanations. Download Your Guide!
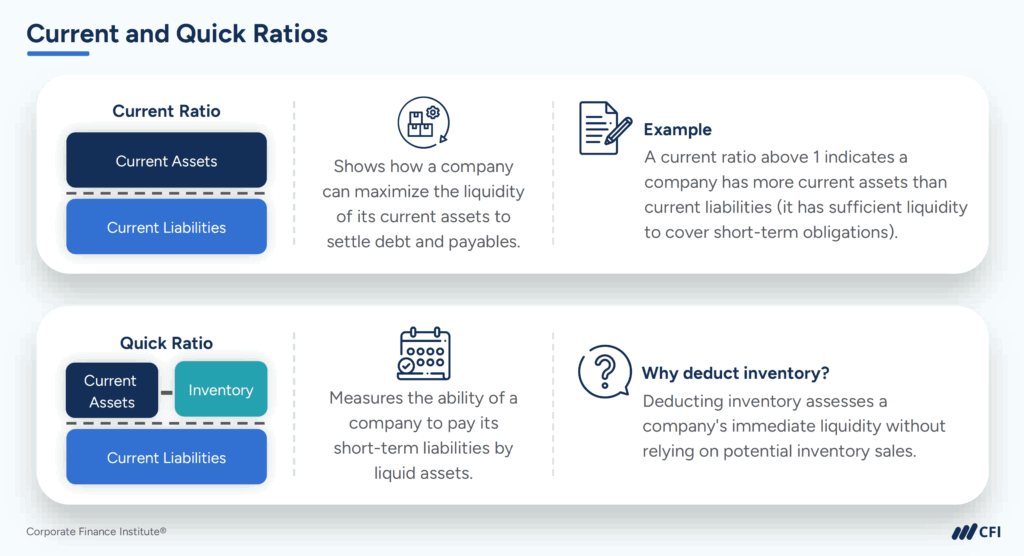
Liquidity ratios measure a company’s ability to meet its short-term obligations using current assets on the balance sheet. They show how easily a business can convert assets into cash to pay bills, suppliers, and other near-term liabilities.
Examples of Liquidity Ratios
Most liquidity ratios indicate a company’s ability to:
The operating cash flow ratio is another liquidity ratio that calculates the number of times a company can pay off its current liabilities with the cash generated in a given period.
Leverage ratios measure how much a company relies on debt financing. They help assess a company’s long-term financial stability and its ability to meet obligations to lenders and creditors.
Examples of Leverage Ratios
Efficiency ratios measure how effectively a business uses its assets and manages its operations to generate sales. Efficiency ratios focus on a company’s ability to quickly convert resources like inventory, receivables, and assets into sales or cash.
Examples of Efficiency Ratios
Profitability ratios measure a company’s ability to generate profits relative to its sales, assets, equity, or other financial metrics. Analysts use profitability ratios to understand how efficiently a company is turning sales into profit and how effectively it’s using its resources to create value.
Examples of Profitability Ratios
Learn more about the different profitability ratios in the following video:
Market value ratios assess how a company is valued in the stock market relative to its financial performance. Analysts use market value ratios to understand whether a company’s shares are fairly priced, undervalued, or overvalued.
Examples of Market Value Ratios
Financial ratios are calculated by dividing figures from financial statements to measure an aspect of a company’s financial health.
Suppose you need to calculate the operating margin ratio of a business that you’re analyzing.
Step 1: Identify the formula for operating profit margin, which is: Operating Margin Ratio = Operating Income / Net Sales x 100.
Step 2: Locate the operating income and net sales figures on the company’s income statement. In this example, the company’s net sales is $50 billion and its operating income is $7.5 billion.
Step 3: Perform the following calculation.
Step 4: Interpret the results.
The company’s operating margin ratio of 15% means that it earns 15 cents of operating profit for every dollar of sales.
Step 5: Benchmark the results.
The final step is to compare the company’s 15% operating margin to a peer group of competitors or the industry benchmark. This comparison lets you evaluate whether the company’s operating margin is high, low, or in the typical range for its peer group or industry.
A single financial ratio, like operating margin, gives you only one piece of information about a company’s financial picture. Analysts typically evaluate a set of ratios across liquidity, profitability, leverage, and efficiency before drawing conclusions. The name for this process is financial ratio analysis.
Financial ratio analysis is the process of evaluating a company’s performance by examining key ratios across liquidity, profitability, leverage, and efficiency. Ratio analysis helps financial analysts identify a company’s strengths and weaknesses, track performance trends, and make comparisons with competitors or industry benchmarks.
Trend analysis is a type of finance ratio analysis used to evaluate a company’s financial performance by comparing data over multiple periods to identify consistent patterns, movements, or tendencies.
With trend analysis, finance professionals examine a company’s three financial statements across several reporting periods to evaluate whether financial performance is improving, declining, or remaining stable.
Trend analysis allows analysts and internal finance teams to forecast future results and identify patterns that might not be visible when looking at a single period. For example, an increasing debt-to-asset ratio can indicate that a company relies heavily on borrowed capital, raising financial risk.
Comparing financial ratios with competitors or industry benchmarks helps analysts to determine a company’s relative performance. These comparisons indicate whether the business is stronger, weaker, or on par with peers, guiding management in identifying competitive advantages and areas for improvement.
Analysts use financial ratio analysis to assess how efficiently a company uses its resources to generate sales and control costs. Efficiency ratios indicate whether assets and liabilities are being managed productively or contributing to unnecessary expenses and financial strain.
Financial ratio analysis is used by a company’s external and internal stakeholders to assess financial health. External users include investors, equity research analysts, lenders, and creditors. Internal users, on the other hand, comprise management and corporate finance teams.
Each group applies ratios differently, depending on their objectives.
Financial ratios are calculations that compare financial statement numbers to evaluate liquidity, leverage, efficiency, profitability, and market value. These ratios are most useful when analyzed together, tracked over time, and compared against peer companies. Applying ratios in this structured way helps analysts, investors, and managers assess performance, identify risks, and make informed decisions.
Financial ratios are calculations that compare two figures from a company’s financial statements to assess the financial health of the business.
The main types are liquidity, leverage, efficiency, profitability, and market value ratios.
Financial analysts use financial ratios to track a company’s financial performance over time, benchmark against peers, and support investment or credit decisions.
Take your analysis skills to the next level with CFI’s Financial Ratios Definitive Guide. This free resource covers 30+ essential metrics that will strengthen your ability to assess a company’s financial health.


