Get Certified for Financial Modeling (FMVA)®
Gain in-demand industry knowledge and hands-on practice that will help you stand out from the competition and become a world-class financial analyst.
Combining the financial results of multiple business units into a single model
A Consolidation Model is constructed by combining the financial results of multiple business units into one single model. Typically, the first worksheet of the model is a summary or consolidation view that shows the highest-level figures (monthly and yearly revenues, profits, costs, productivity rate, etc.) in the form of tables, graphs, or charts. Other tabs in the model display financial data by departments, business units, or product lines, by years, quarters, or months.
In this section, we’ll break down the modeling process step-by-step to explain the details thoroughly. For this sample model, projects are the main “business units“, with their own revenues and costs. This is a very simple model with only a few inputs, but in a real-world business setting, consolidation models can be quite complicated and involve various data sources and in-depth calculations.
The FP&A analyst starts building the consolidation model in Excel by creating multiple workbooks. Each project is assigned to a specific workbook.
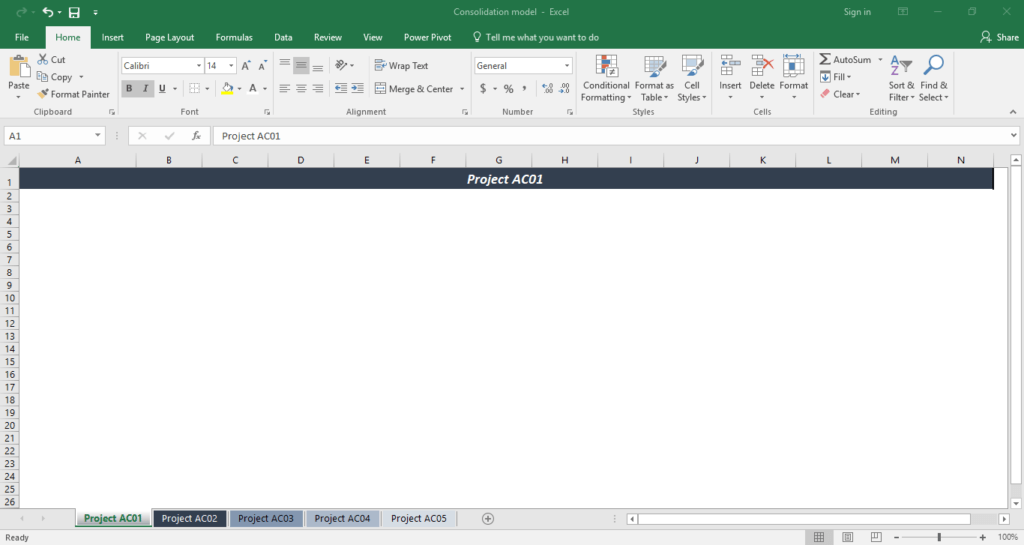
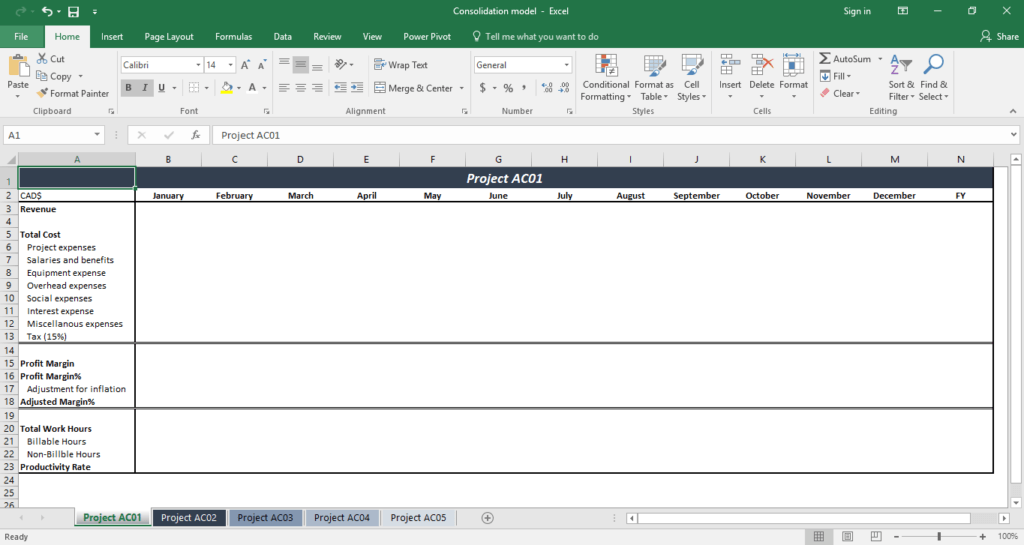
For each project, the FP&A analyst identifies the columns and rows needed. In this model, time (i.e., months) is the main column and the financial metrics (total revenues, total costs, profits, etc.) are the main rows. Starting with the highest-level metrics, the analyst will insert rows for lower-level numbers such as various expenses. Besides the individual months, there is also often a column showing the full-year results or the monthly averages.
Once all columns and rows are identified, the FP&A analyst inputs the corresponding information collected from financial statements or obtained from developing queries on raw data. They are data that needs to be manually filled into the table, so an analyst should use a different color font (blue is used in this sample model) to distinguish the numbers from those that will be calculated.
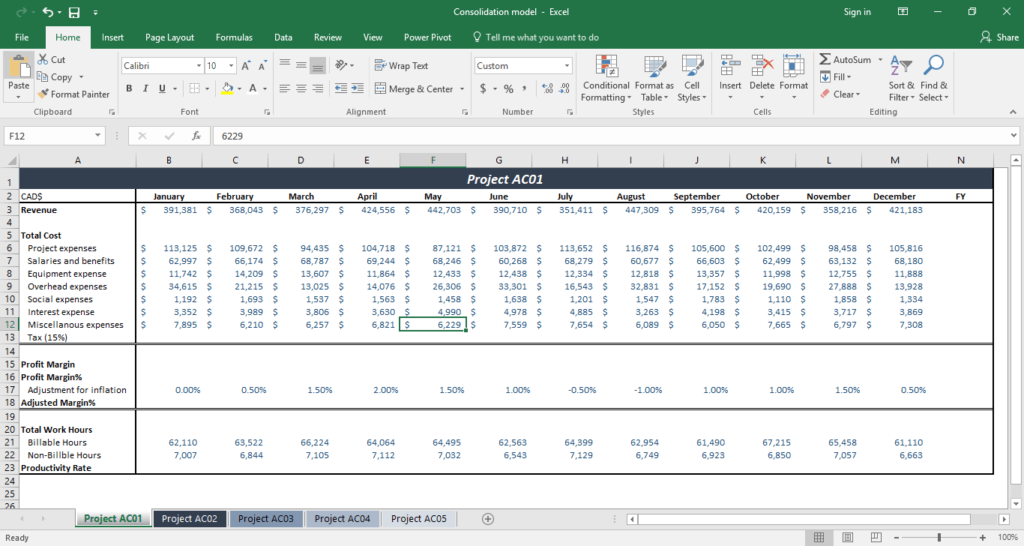
With all the desired information in place, the FP&A analyst can calculate metrics that are not readily available from financial statements or other sources. The metrics may be figures such as total costs for each project, profit margins, and productivity rates. Formulas such as SUM, AVERAGE, and SUMPRODUCT are commonly used in the calculations. The analyst should always include cell references in their formulas to better track calculation errors. The numbers should be shown in black or other colors to distinguish them from the manually-encoded data.
After completing the data tables, the analyst should always validate the data with the numbers in the financial statements to ensure accuracy. This is a very crucial step in building consolidation models—one that must be completed before proceeding to the last few steps.
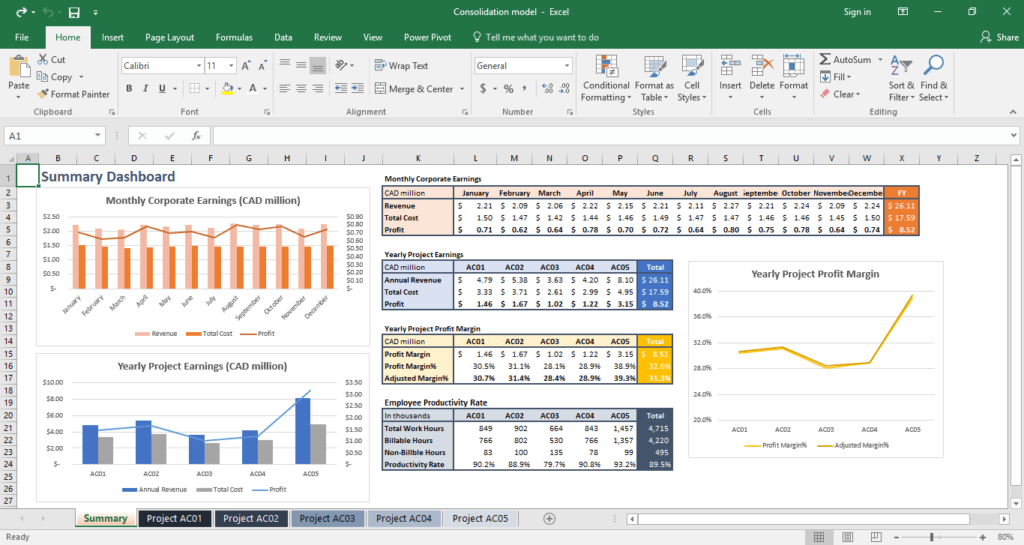
When all individual project analyses are completed, the FP&A analyst creates a summary or consolidation worksheet as the first tab of the model. This is a page to summarize all the project financial metrics and present the highest-level information that is important to managers and corporate decision-makers. Analysts can create tables to display figures such as total revenue, total costs, profit margins, and margin percentages of the entire business. They can also include information that is helpful to managers in improving operating efficiencies such as employee productivity rates.
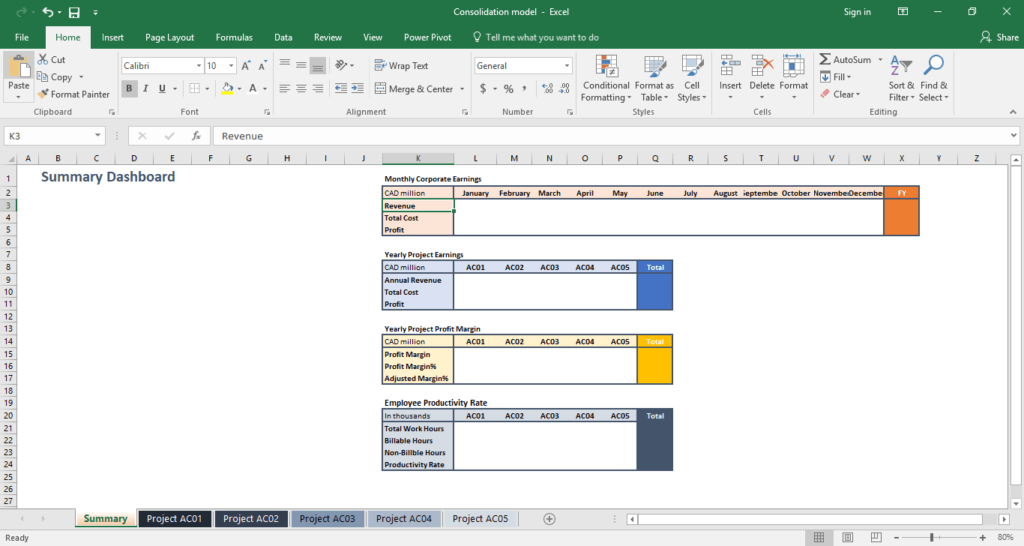
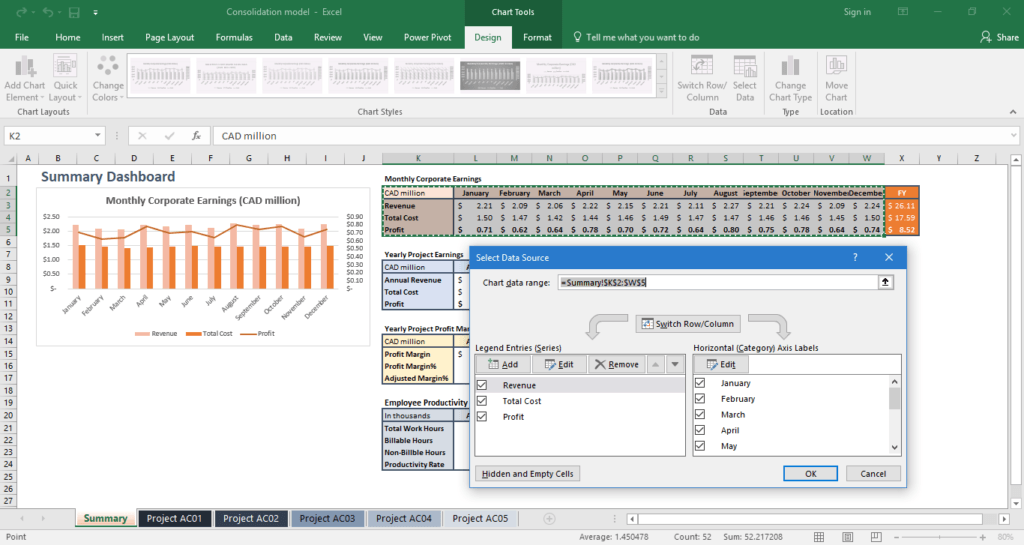
The next step is to insert numbers into the summary tables by using formulas. In the formulas, the analyst should always use cell references from individual project tabs instead of simply plugging in the numbers. This is to make sure the right figures are used in the calculations and to enable the analyst to return to, and check, the reference cells if variances exist.

Using the data in the summary tables, the analyst inserts charts and graphs to present information in meaningful and easy-to-interpret formats. There are several types of charts utilized by FP&A analysts to visualize the data, so simply choose the types that would best represent the data characteristics and analytical trends.
Lastly, clean up, format, and embellish the consolidation model to make it look professional. This is very important because the management team does not want to see an unorganized dashboard where they will find the financial figures difficult to understand.
CFI is the official provider of the Financial Modeling & Valuation Analyst designation and is on a mission to help you advance your career.
To continue learning and developing your skills, these additional free CFI resources will be helpful:
To master the art of Excel, check out CFI’s Excel Crash Course, which teaches you how to become an Excel power user. Learn the most important formulas, functions, and shortcuts to become confident in your financial analysis.

Launch CFI’s Excel Crash Course now to take your career to the next level and move up the ladder!


