Financial Portfolio Template
Download our free portfolio beta template
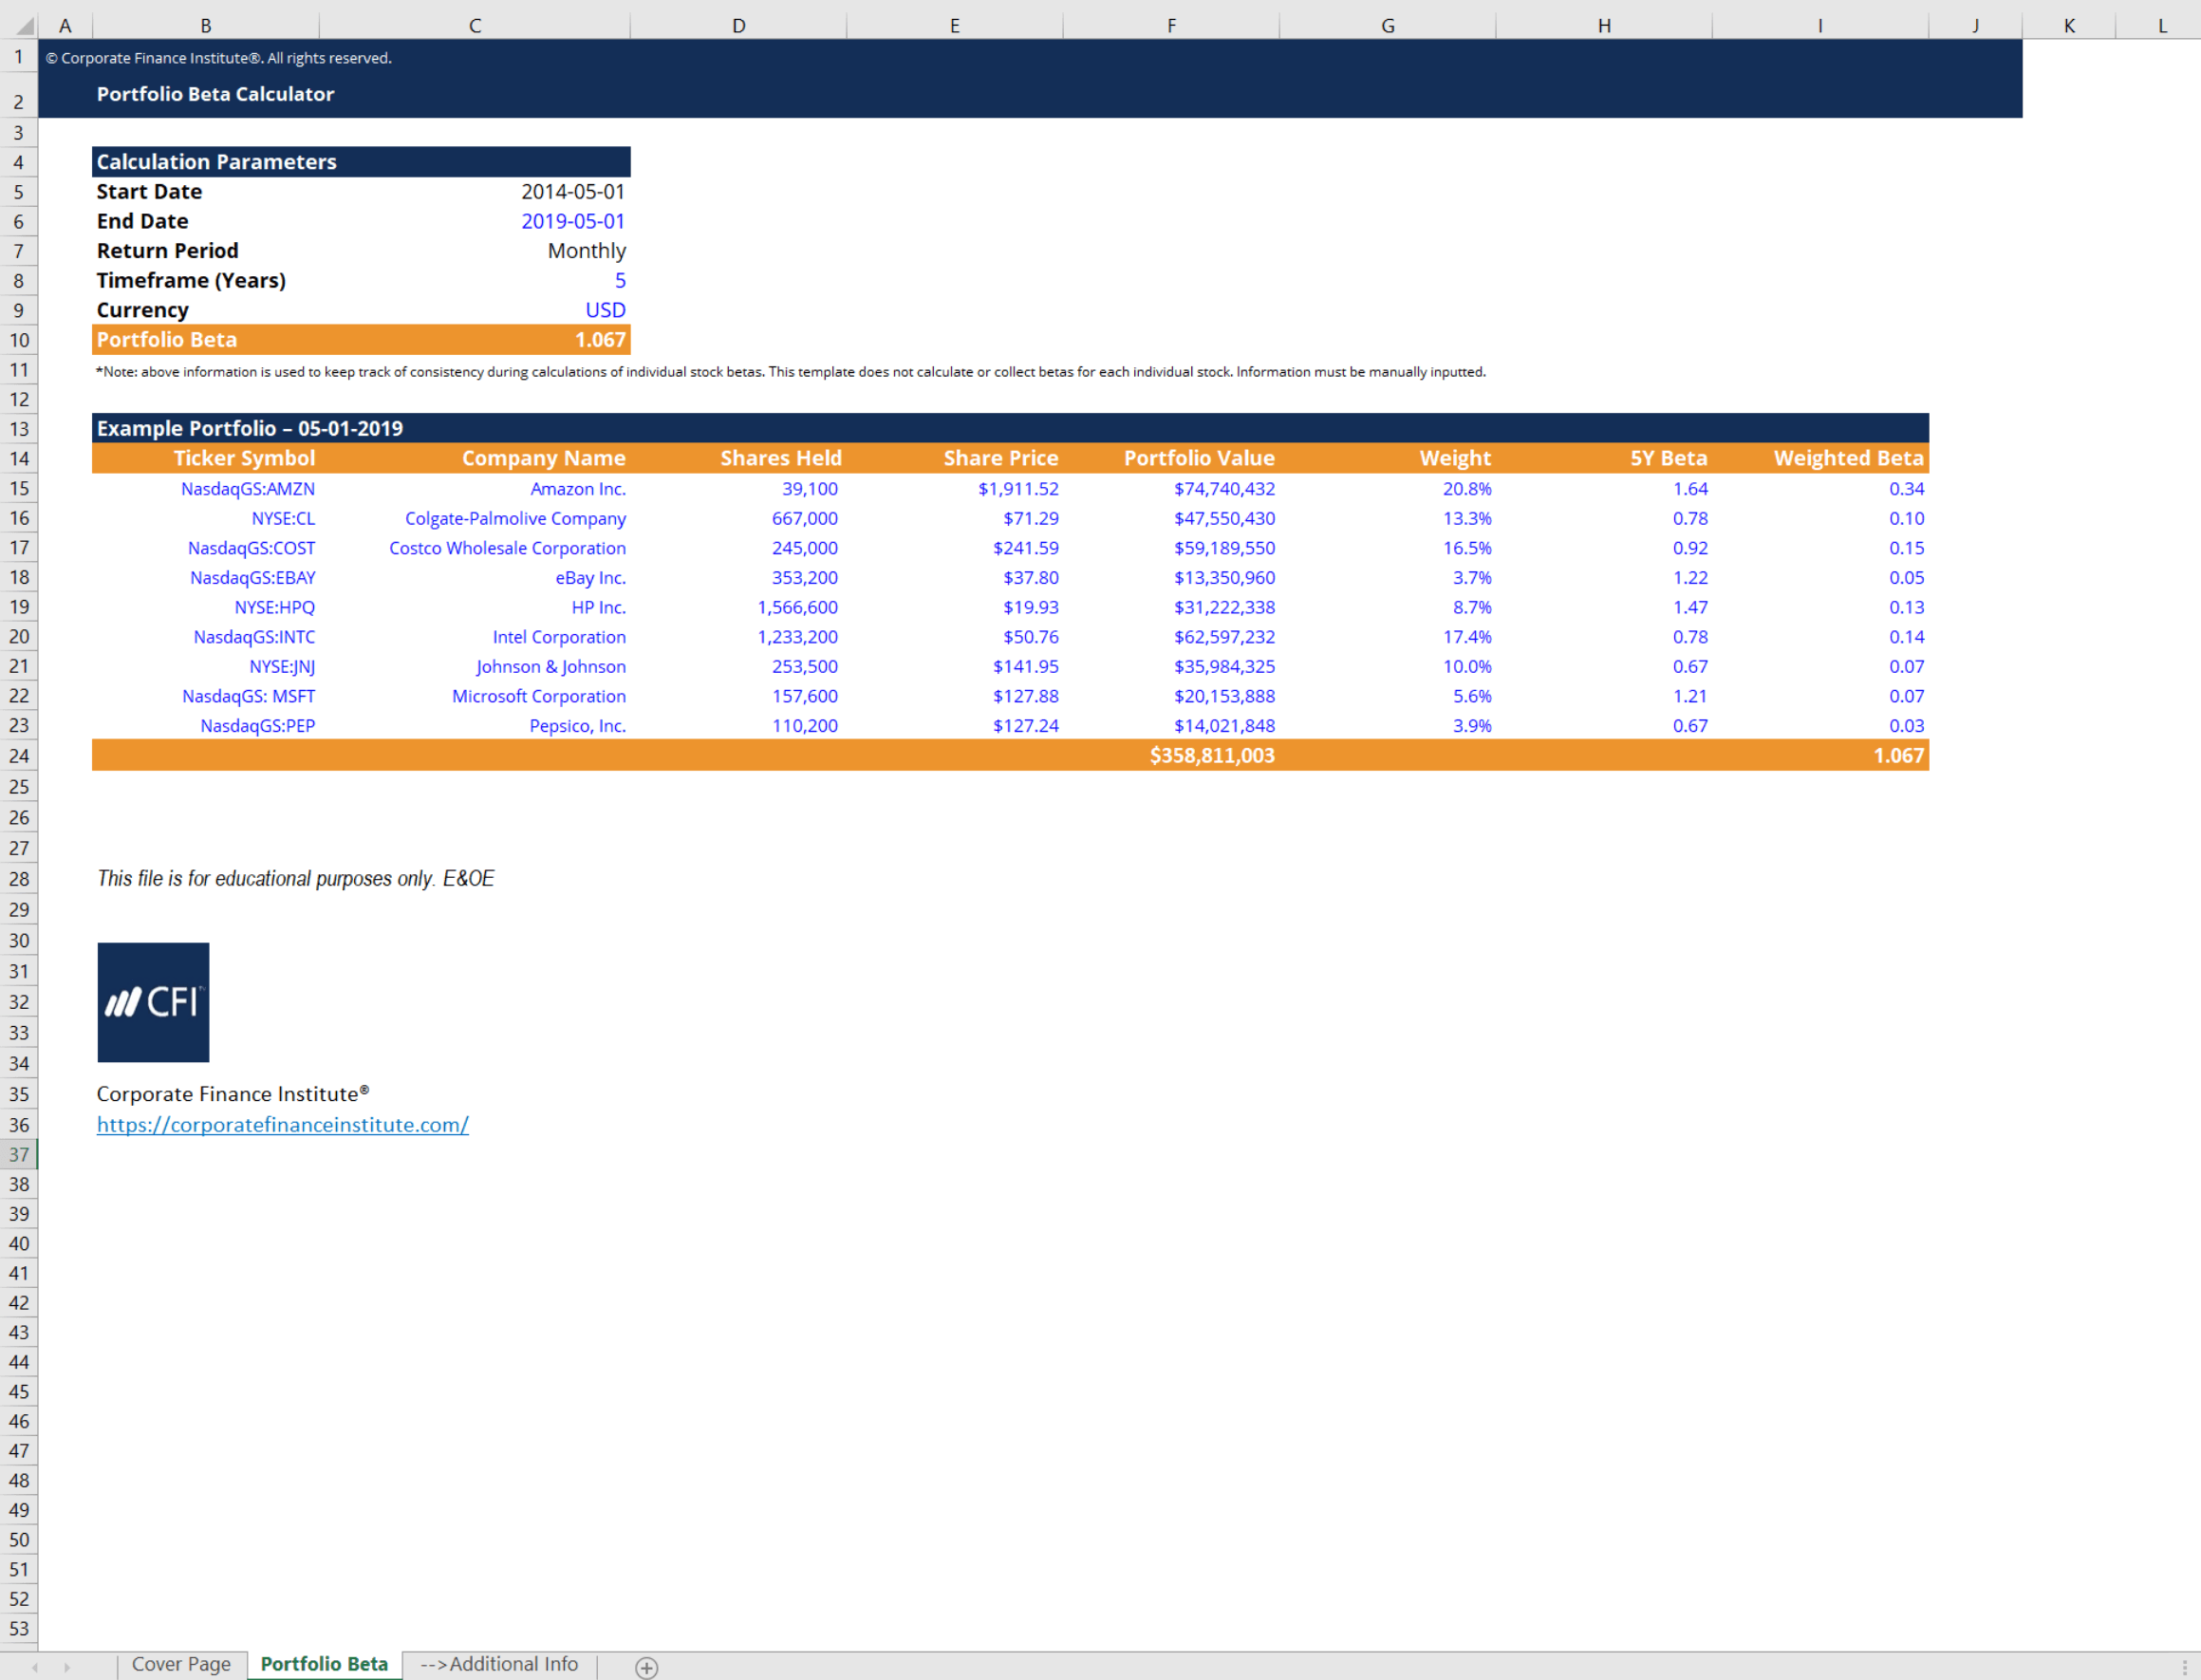
Investment Portfolio Beta Template
This portfolio beta template will help you calculate the weighted average beta of all of the stocks in your investment portfolio. Beta (β), as a measure of volatility relative to the market, is an important financial metric to consider to evaluate how an investor’s portfolio responds to the market.
Here is a quick preview of CFI’s portfolio beta template:
Download CFI’s Free Investment Portfolio Beta Template
Download CFI’s Excel template to advance your finance knowledge and perform better financial analysis.
Introduction to Investment Portfolio Management
Successful investing isn’t about guesswork but strategy, structure, and consistency. Efficient portfolio management helps you build wealth, manage risk, and capitalize on market opportunities. Whether you’re aiming for long-term growth, passive income, or financial independence, having the right portfolio structure is essential.
This guide breaks down how to structure, monitor, and optimize your investments, ensuring they align with your financial goals. To simplify the process, a free Excel investment portfolio spreadsheet provides an efficient way to track holdings, measure performance, and make informed adjustments.
Setting Up Your Investment Portfolio
An investment portfolio isn’t just a collection of stocks—it’s a blueprint for your financial future. Without a structured approach, it’s easy to fall into reactionary investing, making decisions based on short-term market movements rather than long-term strategy.
Here’s how to build a portfolio that works for you.
1. Define Your Investment Goals
Before choosing investments, you need a clear destination. Are you focused on:
- Wealth growth? Stocks, ETFs, and high-growth assets offer the best long-term upside.
- Income generation? Dividend-paying stocks, bonds, and real estate can provide steady cash flow.
- Capital preservation? Conservative investments like bonds and blue-chip stocks help protect assets.
For example, you need a structured investment strategy if you aim to reach $1 million in investment assets or generate $50,000 in passive income. Using an Excel investment portfolio template helps map out how much to invest, where to allocate funds, and how to track progress toward your goal.
2. Assess Your Risk Tolerance
Risk tolerance plays a huge role in how you react to market swings. Can you stay invested through downturns, or will a 20% portfolio drop cause panic?
- High-risk investors thrive in stocks, emerging markets, and alternative assets.
- Moderate-risk investors balance growth and stability with a mix of stocks and bonds.
- Conservative investors prioritize capital protection with fixed-income assets and blue-chip stocks.
Utilizing a well-structured investment spreadsheet template provides clear risk assessments, helping you determine whether your asset mix matches your risk tolerance and time horizon.
3. Choose Your Asset Allocation
Your asset mix determines your risk-reward balance. A well-diversified portfolio smooths out market volatility while optimizing returns. Here are some common types of assets and what they bring to your portfolio:
- Stocks: Drive long-term growth but come with greater volatility.
- Bonds: Provide steady income and lower risk.
- Real Estate: Tangible assets that hedge against inflation.
- Commodities: Gold, oil, and agricultural products add market diversification.
- Cash & Equivalents: Ensure liquidity for short-term needs.
A financial portfolio template helps you manage asset allocation, ensuring your investments are balanced and strategically positioned.
4. Select Your Investments
Choosing individual investments can be overwhelming. If you’re looking at selecting investments for your portfolio, an Excel template makes comparisons easier. Here’s how to approach selection:
- Individual Stocks: High-reward, high-risk. Best for hands-on investors.
- ETFs & Mutual Funds: Diversified investments that minimize risk.
- Index Funds: Passive, low-cost funds that track the market.
- Bonds: Offer predictable returns and stability.
Rather than chasing “hot stocks,” a long-term, structured approach ensures your portfolio remains resilient across market cycles.
5. Monitor and Adjust
The market isn’t static, and your portfolio shouldn’t be either. Ongoing monitoring and adjustments keep your investments aligned with your financial goals.
- Quarterly & Annual Reviews: A structured check-in ensures performance matches expectations.
- Rebalancing: If high-performing assets dominate your portfolio, rebalancing prevents unnecessary risk exposure.
- Adapting to Life Events: A job change, marriage, or nearing retirement may require adjusting your strategy.
Rather than guessing when to rebalance, a free Excel investment portfolio spreadsheet provides automated insights, helping you make data-driven decisions.
Beta and Financial Markets
Beta (β) is a measure of the volatility of returns with regard to the performance of the market. By observing beta, financial analysts try to link the performance of a stock to how well the stock market is doing. To further elaborate, a company with a higher beta is assumed to have a higher risk and higher returns.
The value of beta can be interpreted as follows:
- β > 1: More volatile compared to the market
- β = 1: Exactly as volatile as the market
- 0 < β < 1: Less volatile compared to the market
- β = 0: Completely uncorrelated with the market
- β < 0: Negatively correlated with the market
For example, we can look at a high-risk technology firm with a beta of 2. This is a firm that is more volatile than the market and will, on average, return significantly more than the market returns in a given period.
Additionally, Beta is an integral part of the Capital Asset Pricing Model (CAPM). The CAPM is used to calculate the expected return on a security. The formula for the CAPM is as follows:

Where:
Ra = Expected return of the security
Rrf = Risk-free rate
Ba = Beta (β) of the asset
Rm = Expected return of the market
You can see that beta is a multiplier to the market risk premium (Rm – Rrf) in this formula. Therefore, by examining the CAPM, we can deduce how a higher beta would result in higher returns if the market was performing well. However, we can also see how a high beta would result in lower or even negative returns if the market was performing poorly.
Use CFI’s portfolio beta template to calculate the beta of your entire portfolio!
Connect what you just learned to a clear career path with CFI’s role‑based courses and certification programs.
Additional Resources
For more resources, check out our business templates library to download numerous free Excel modeling, PowerPoint presentations, and Word document templates.
Excel Tutorial
To master the art of Excel, check out CFI’s Excel Crash Course, which teaches you how to become an Excel power user. Learn the most important formulas, functions, and shortcuts to become confident in your financial analysis.

Launch CFI’s Excel Crash Course now to take your career to the next level and move up the ladder!


