Get Certified for Financial Modeling (FMVA)®
Gain in-demand industry knowledge and hands-on practice that will help you stand out from the competition and become a world-class financial analyst.
Ever wondered why some SaaS companies skyrocket to unicorn status while others struggle to stay afloat? The difference often comes down to how they monitor and act on key performance indicators (KPIs).
SaaS businesses present distinct financial patterns that require specialized KPIs that reflect the unique nature of subscription models, including:
With so many KPIs available, how do you know which ones matter most? This will vary somewhat depending on a company’s growth stage, business model, and market. But certain KPIs consistently prove valuable across all SaaS companies.

Financial analysts tracking SaaS companies need specific metrics to build reliable models and valuations. These 17 essential SaaS KPIs help analysts understand performance trends, make data-driven decisions, and accurately project future growth. This guide covers five categories of KPIs to help you understand how they fit into a comprehensive evaluation framework.
Annual recurring revenue (ARR) is the recurring revenue a company expects to generate annually from its customers. ARR represents the stable, recurring portion of revenue from customer subscriptions and contracts.
Monthly Recurring Revenue (MRR) measures the revenue generated monthly from subscriptions, providing a normalized view of financial performance. It offers consistent, comparable growth trends crucial for SaaS analysis. The metric consists of three sub-types: new, expansion, and churn MRR.
Bookings represent the total value of future revenue during a specific period. Unlike ARR and MRR, bookings encompass both subscription and non-subscription revenue. Bookings function as promises of future revenue that is not yet earned. Bookings convert to actual revenue only after service delivery.
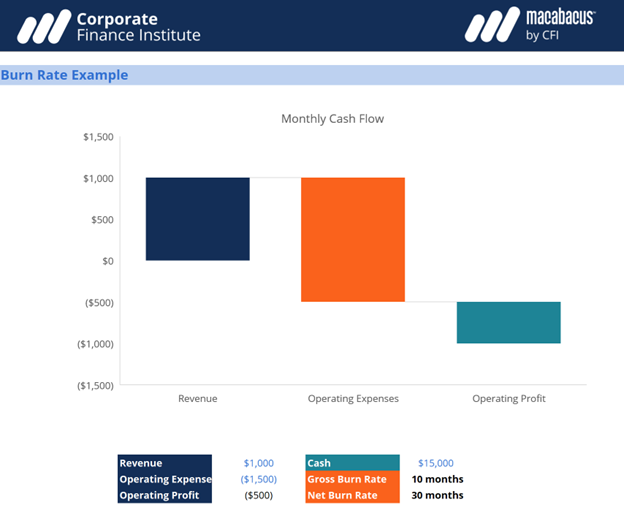
Burn Rate tracks how quickly a business depletes its cash reserves. This metric proves critical for startup valuation when growth takes priority over immediate profitability. For some companies, high burn rates indicate potential financial distress. For early-stage businesses, it may simply signal investors need to allocate additional capital so the company can continue operating.
Average Revenue Per User (ARPU) assesses revenue-generating capabilities at the per-customer level. Calculated simply as total revenue divided by average subscribers, this metric reveals critical insights into profitability potential. Financial analysts commonly deploy ARPU for segmentation analysis, peer comparisons, and valuation modeling.
The SaaS Magic Number evaluates how effectively a company converts marketing spend into revenue growth. At a basic level, the magic number is calculated by dividing revenue growth by sales and marketing expenses. When a company achieves a Magic Number exceeding 0.75, it demonstrates efficient customer acquisition and signals strong potential for scaling profitably.
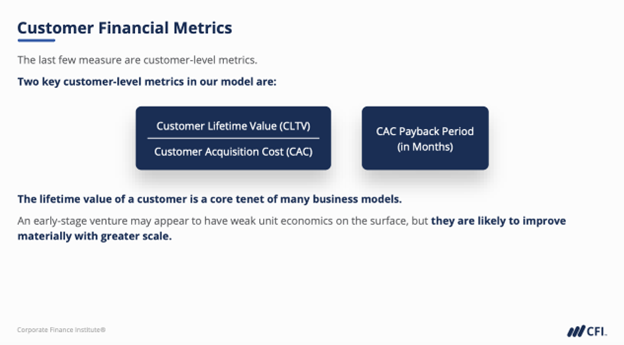
LTV (or CLTV) predicts the total revenue a customer will generate throughout their relationship with a SaaS company. The higher the LTV, the more valuable a customer is to your business because they generate more revenue and are more likely to renew or upgrade. Though frequently overlooked, this forward-looking metric proves essential for growth planning and investment decisions.
Expansion MRR Rate measures additional revenue generated from existing customers through upgrades, cross-sells, and add-ons. This growth metric focuses exclusively on expanding relationships with current customers, excluding new customer revenue. It reveals how effectively companies monetize their established customer base over time.
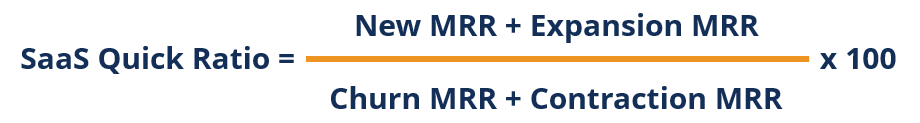
Unlike its accounting namesake, the SaaS Quick Ratio evaluates growth efficiency in subscription businesses. This powerful metric compares revenue gains (new and expansion MRR) against losses (churned and contraction MRR). Higher ratios indicate stronger net growth despite inevitable customer churn.
Customer Acquisition Cost (CAC) measures all resources and expenses required to acquire a new customer. A core metric for SaaS, CAC helps companies and investors evaluate marketing efficiency and investment returns. Financial analysts typically pair CAC with lifetime value metrics to determine if customer acquisition strategies generate sufficient long-term value.
CAC Payback Period measures how long it takes to recover customer acquisition investments. Optimizing this metric directly impacts cash flow and profitability, making it crucial for SaaS businesses with high upfront marketing costs. Shorter payback periods typically indicate healthier unit economics and more capital-efficient growth strategies.
The LTV-to-CAC Ratio compares customer lifetime value (LTV) to the cost of acquiring them (CAC). Calculated by dividing LTV by CAC, it measures return on sales and marketing investments. A healthy benchmark is 3:1, meaning companies earn three dollars for every dollar spent on acquisition, which indicates a sustainable, scalable growth model.
Customer Retention Rate measures the percentage of customers who continue their relationship with a company over time. This forward-looking metric serves as a critical indicator of growth potential and customer satisfaction. High retention rates demonstrate a company’s ability to deliver sustained value, driving predictable revenue streams.
Customer Churn Rate is the proportion of contractual customers who terminate their subscriptions within a specific timeframe. High customer churn typically leads to high revenue churn, directly impacting financial stability. Predicting and managing this metric is critical for long-term success. Companies combat churn through satisfaction programs, loyalty rewards, and product improvements based on customer feedback.
Monthly Active Users (MAU) means the unique users who interact with a product or service within a month. This engagement metric reveals crucial insights into user growth patterns. Financial analysts and investors monitor MAU to evaluate a company’s ability to attract new customers while maintaining relationships with existing ones, which is a fundamental indicator of product-market fit.
Customer Engagement SScore (CES) quantifies customer engagement through a single, comprehensive metric. It evaluates how actively customers interact with products and services based on their usage patterns and online behaviors. High engagement scores typically correlate with increased retention and expansion revenue, making this metric valuable for forecasting growth.
Net Promoter Score (NPS) measures customers’ willingness to recommend a company’s offerings to others. This powerful metric serves as a key indicator of loyalty and satisfaction. By identifying dissatisfied customers and converting them into promoters, companies can leverage NPS to drive new referrals, reduce churn, and accelerate organic growth.
Understanding these 17 critical SaaS KPIs is valuable, but the real advantage comes from integrating them into comprehensive financial models that drive strategic decisions. Top financial analysts connect these metrics to reveal powerful insights. This interconnected approach requires specialized modeling skills that capture SaaS-specific patterns in revenue recognition and customer behavior.
Whether analyzing investments or managing a startup’s financial strategy, these skills make you invaluable in high-growth environments.
Ready to transform your SaaS metrics knowledge into practical financial modeling expertise?
CFI’s Financial Modeling & Valuation Analyst (FMVA®) Certification equips you with the modeling, forecasting, and finance skills to lead in high-growth companies. Once you’ve built a strong foundation, the Startup Financial Model & Valuation elective course shows you how to apply those tools in a startup setting, so you can make faster, smarter financial decisions when it matters most.
Get certified and advance your career today.
SaaS Financial Modeling: A High-Level Overview
Corporate Finance for Startups


