Sharpe Ratio Table Template
Sharpe Ratio Table Template
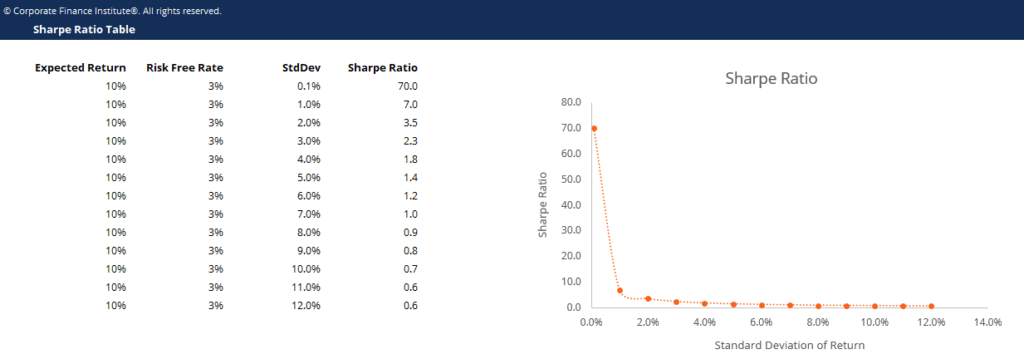
This Sharpe ratio table template demonstrates the calculation of the Sharpe ratio (using the arithmetic mean) given the expected portfolio return, risk-free rate, and standard deviation of the portfolio return.
Below is a screenshot of the Sharpe ratio table template:
Download the Free Template
The Sharpe Ratio (or Sharpe Index) is commonly used to calculate the performance of an investment by adjusting for its risk.
The higher the ratio, the greater the return of portfolio relative to the risk taken, and thus, the better the investment. The ratio can be used to evaluate a single stock or investment, or an entire portfolio.
Sharpe Ratio Formula
Sharpe Ratio = (Rx – Rf) / StdDev Rx
where:
- Rx = Expected portfolio return
- Rf = Risk-free rate of return
- StdDev Rx = Standard deviation of portfolio return / volatility
It’s all about reducing volatility. If an investment had an annual return of only 10% but had zero volatility, it would have an infinite (or undefined) Sharpe Ratio.
Of course, it’s impossible to have zero volatility, even with a government bond (prices go up and down). As volatility increases, the expected return has to go up significantly to compensate for that additional risk.
More Free Templates
For more resources, check out our business templates library to download numerous free Excel modeling, PowerPoint presentation, and Word document templates.
Excel Tutorial
To master the art of Excel, check out CFI’s Excel Crash Course, which teaches you how to become an Excel power user. Learn the most important formulas, functions, and shortcuts to become confident in your financial analysis.

Launch CFI’s Excel Crash Course now to take your career to the next level and move up the ladder!


