Everything You Need to Know about Forecasting Headcount Spend

Why and how to correctly forecast spend on headcount

Over 1.8 million professionals use CFI to learn accounting, financial analysis, modeling and more. Start with a free account to explore 20+ always-free courses and hundreds of finance templates and cheat sheets.

How to Forecast Headcount Spend

Your headcount spend is one of the most important numbers to project correctly.

Most people don’t realize that their headcount typically accounts for 50-80% of their cash burn. But it makes sense — a company’s biggest asset is its people, so it shouldn’t come as a surprise that it may be the biggest expense as well.

That’s why it’s crucial to understand your headcount forecast. Even the slightest mistake can make a huge impact on planning.

When you project your headcount spend correctly:

  • You get insights into who you can hire and when
  • You understand where your cash is going
  • You get ahead of any surprises

When done incorrectly:

  • Your cash-out date hits sooner than expected
  • You may be forced to do layoffs, with exit packages and other unexpected costs
  • Company morale takes a hit as others fear for their job security

Let’s get into the why, how, and what of forecasting headcount the correct way.

Why Should You Forecast Your Headcount Spend?

Your headcount spend will often account for 50 to 80% of your cash burn each month. Within this, the salary costs are the main driver of structure costs.

A good forecast can help determine the break-even point for the company to cover the structure costs. It provides the sales volume needed to reach profitability.

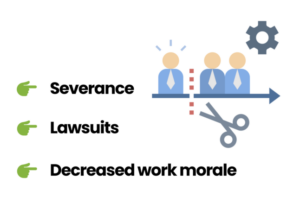
Your headcount spend can also be one of the most challenging costs to reduce, with a number of challenges ensuing from lay-offs — including severance, lawsuits, and decreased work morale.

challenges from incorrect forecasting of headcount spend

Forecasting your headcount expense will allow you to make better informed decisions as you plan for your cash burn for the next 12-18 months.

How Do You Forecast Your Headcount Spend?

To begin, you need to define your needs for the next 12 to 24 months depending on your backlog and sales projections.

  1. Start by collecting information on your existing hires from your payroll platform, and entering it into a spreadsheet.
  2. Next, begin adding your projected hires one by one.
  3. For a long-range forecast (12 months or more into the future), add roles in bulk.
  4. If you have department heads, it may be best to check with each on their upcoming hiring plan.
  5. Consolidate and review the consistency of all headcount with the management team.

A chart showing a list of employees and projected spend on salaries for each position for the purposes of headcount accounting and forecasting

How Do You Calculate Projected Spend?

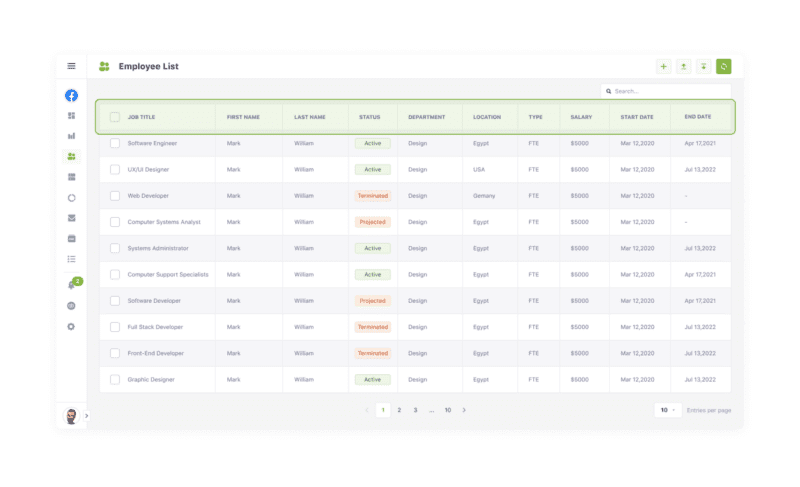
Now that you have your inputs, it’s time to calculate your projected spend for each month. There are two ways to go about doing this:

The simple method

  1. Determine the departments with direct FTE.
  2. Apply the business growth ratio to the direct FTE to calculate the traditional headcount.
  3. Use one salary increase rate across the board to calculate the salary costs for next year.
  4. Your salary costs for next year should be (# of FTE next year X average salary per FTE current year X (1+salary increase).

How to calculate salary costs

The detailed method

Prorate the salary for any hires who joined this month, or were terminated.

How to calculate prorated salaries

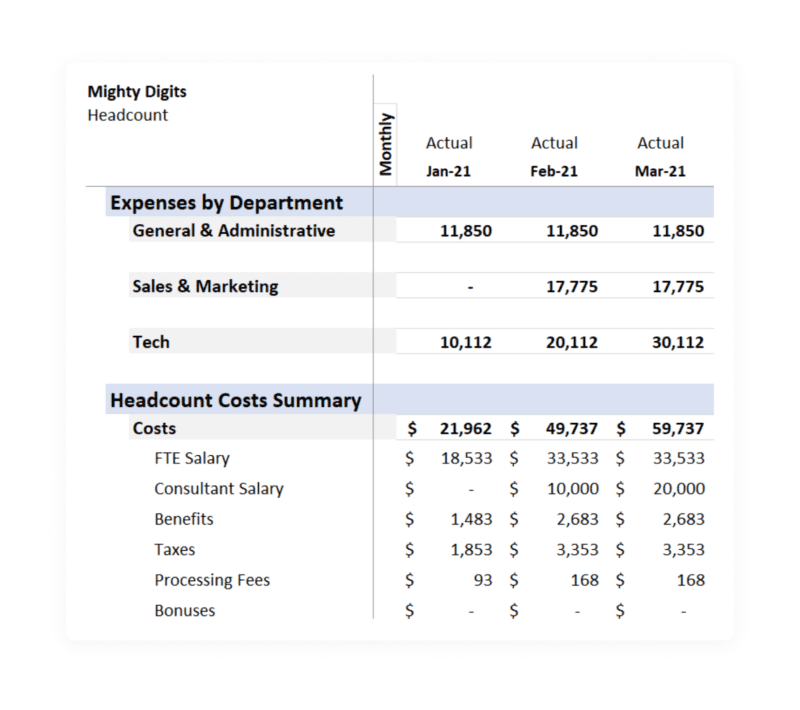
Full-time employees have a number of other incidental costs:

  • Employer payroll taxes which are around 8 to 10% of salary
  • Health benefits which are around 8 to 10% of salary, or a fixed dollar amount per employee
  • Payroll processing fees which is around 2.5% of salary, or a fixed dollar amount per employee

Other payroll costs to consider

  • Bonuses
  • Commissions (could be monthly, quarterly, or annually)
  • Recruiting fees (often a percentage of first year salary)
  • Training costs
  • Additional structure costs that include place, energy, and equipment — these could be marginal if the structure is already big, but for a smaller team, this is an impact to consider

Putting It All Together

Once you have all the information entered, you can start to use it to analyze your headcount:

Slice and dice your data on a department basis, and by each cost type

A chart showing a company's headcount costs summary

Use graphs to understand costs and hires by department and across multiple periods

A graph showing a company's total headcount and total headcount expenses over time

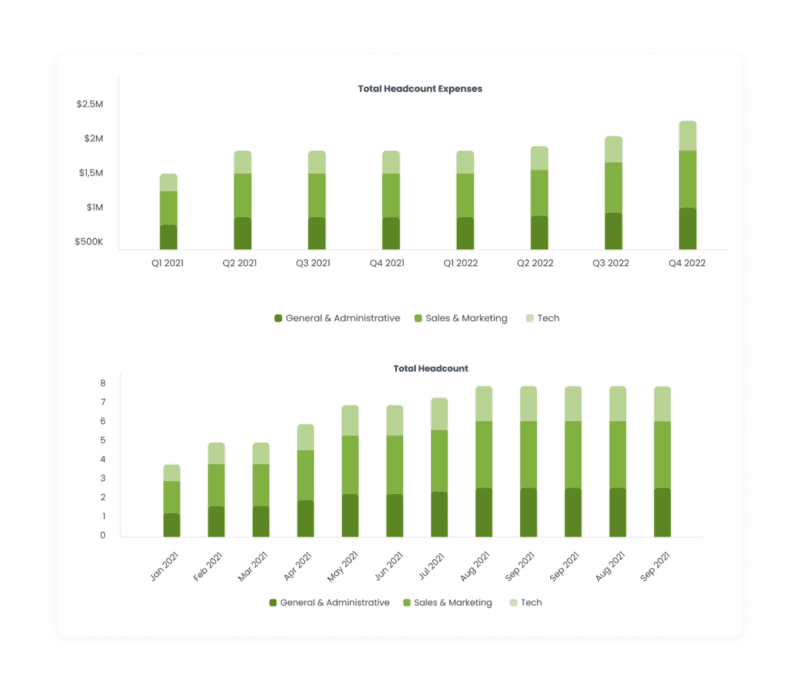
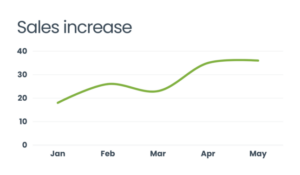
Use ratios like FTE increase VS sales increase

Increase in full-time employees A line graph showing an increase in sales over time

Being in full control of your headcount planning allows you to analyze the data in a variety of ways. This includes:

  • Headcount: The evolution per month and compared to your budget.
  • Percentage of direct employees: A direct employee works directly on a project or production order, whereas an indirect employee has more of a supervisory or a support function role — figure out what employees are working directly on projects and which are supporting.
  • Flexibility: You gain flexibility through contractors or temporary workers, and understanding this will help you know how much you can reduce or increase your activity to adapt to the business demand.
  • Capacity: Compare the gross capacity (hours before holidays, sickness, leaves) as well as the net capacity to help explain why there are less or more hours worked.
  • Turnover rate: The number of employees leaving the company compared to the total number of employees. You can see if there is some anomaly in some departments or some reason for the turnover.

The key is to not just create the headcount forecast and stop there. You want to provide ongoing reporting to ensure that the company continues to stay aligned on its plan, and its progress against that plan.

Analyst Certification FMVA® Program

Below is a break down of subject weightings in the FMVA® financial analyst program. As you can see there is a heavy focus on financial modeling, finance, Excel, business valuation, budgeting/forecasting, PowerPoint presentations, accounting and business strategy.


Financial Analyst certification curriculum


A well rounded financial analyst possesses all of the above skills!


Additional Questions & Answers

CFI is the global institution behind the financial modeling and valuation analyst FMVA® Designation. CFI is on a mission to enable anyone to be a great financial analyst and have a great career path. In order to help you advance your career, CFI has compiled many resources to assist you along the path.

In order to become a great financial analyst, here are some more questions and answers for you to discover:


0 search results for ‘