Get Certified for Financial Modeling (FMVA)®
Gain in-demand industry knowledge and hands-on practice that will help you stand out from the competition and become a world-class financial analyst.
Comparing costs and activities
Cost behavior analysis refers to management’s attempt to understand how operating costs change in relation to a change in an organization’s level of activity. These costs may include direct materials, direct labor, and overhead costs that are incurred from developing a product. Management typically performs cost behavior analysis through mathematical cost functions.
Cost functions are descriptions of how a cost (e.g., material, labor, or overhead) changes with changes in the level of activity relating to that cost. For example, total variable costs will change in relation to increased activity, while fixed costs will remain the same. Cost functions may come in various forms.
To learn more, launch our financial analysis courses!
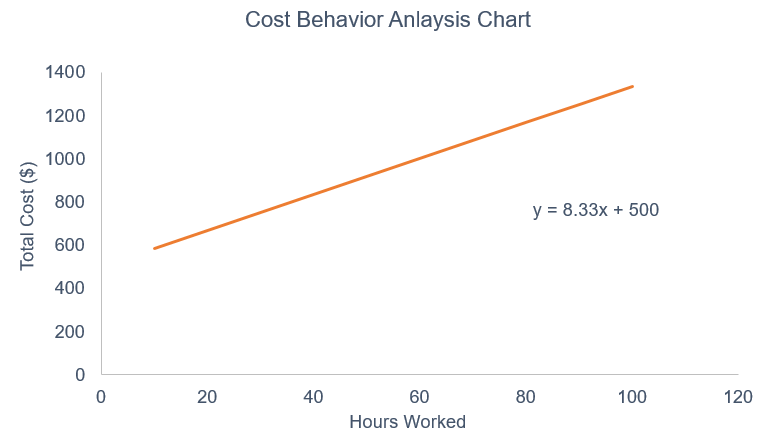
Cost functions are usually given in the form of y = mx + b and can be plotted on a graph.
In order to determine these cost functions, managers typically make the following assumptions for simplicity reasons:
The relevant range here refers to the range of activity in which the relationship between the total cost and the level of activity is maintained. However, in real-life situations, not all cost functions are linear and are not explained by a single cost driver.
To learn from video examples, take our financial analysis courses!
It is common for management to use quantitative analysis methods to illustrate cost functions. The simplest approach is the high-low method. This method uses only the highest and lowest values of the cost driver and its respective costs to determine the cost function.
Although there are many limitations to this approach, it is a simple first attempt at examining the relationship between the cost driver and the overall costs.
Regression analysis is another method that uses statistical methods to measure the average amount of change in the dependent variable associated with changes in the independent variable. The regression approach is a much better indication of the relationship between the variables. Software such as Microsoft Excel is a useful tool for performing regression analysis.
XYZ Company would like to examine how overhead costs behave with changes in labor hours:
| Month | Total Overhead Costs | Labor Hours |
| March | $50,000 | 2,000 |
| April | 70,000 | 3,000 |
| May | 55,000 | 1,500 |
| June | 65,000 | 3,500 |
| July | 55,000 | 1,000 |
| August | 65,000 | 2,000 |
| September | 45,000 | 1,500 |
| October | 80,000 | 4,000 |
| November | 55,000 | 2,500 |
| December | 60,000 | 2,500 |
Here is the cost data that was observed:
| Hours | Cost | |
| Highest Observation | 4,000 | $80,000 |
| Lowest Observation | (1,000) | (55,000) |
| Difference | 3,000 | 25,000 |
Slope or Variable Cost: 25,000/3,000 = $8.33
Y Intercept or Fixed Cost: 55,000 – 8.33 * 1000 = $46,667
Therefore, the full cost function is: Y = 8.33x + 46,667. This means that for every additional labor hour, total overhead costs will increase by $8.33.
See more examples in our Financial Analysis Fundamentals course.
Using regression cost behavior analysis, the approach is fairly similar but uses all data points instead of just the highest and lowest values.
Using the regression function in MS Excel, we can obtain an ANOVA output that gives a cost function of Y = 8.72x + 39,502.
This means that for every additional labor hour, the total overhead costs will increase by $8.72 and if there are no labor hours, the total overhead costs would just be equal to the fixed cost of $39,502.
Under the regression approach, we can analyze the cost function using several criteria:
| Economic Plausibility | Degree of Fit | Confidence | |
| Main Concept | Is it plausible that the total overhead costs are affected/determined by labor hours? | Determined by the R squared value of the regression output. The higher the number, the greater the change in the dependent variable can be explained by the independent variable. | Relationship between the standard error and the intercept (fixed cost) and the x variable (variable cost) |
| Analysis of Example | It does appear logical that total overhead costs and labor hours are related. | R squared is 0.64. So, 64% of the change in overhead costs can be explained by the change in labor hours. | With a T-stat greater than 2, the relationship is acceptable. |
Learn about regression analysis in our financial math course!
In the content above, we examined two methods of analyzing cost behaviors. However, many companies often examine the relationship between multiple independent variables and a single dependent variable.
Frequently, companies may also conduct analyses on each variable and then do the combined analysis to further examine the effects of each independent variable on the dependent variable. The general takeaway is that there are many different ways of analyzing cost behavior data within a company, and it is up to management to decide how in-depth they intend to take the analysis.
In a world shifting to a more data- and technology-based economy, analyzing data in various ways will benefit companies if they implement the necessary measures.
Learn financial analysis online now!
Click the button below to download our free Cost Behavior Analysis template!
Connect what you just learned to a clear career path with CFI’s role‑based courses and certification programs.
Thank you for reading CFI’s guide to Cost Behavior Analysis. To keep learning and advancing your career, please see the additional CFI resources below:


