Get Certified for
Commercial Banking (CBCA®)
Stand out and gain a competitive edge as a commercial banker, loan officer, or credit analyst with advanced knowledge, real-world analysis skills, and career confidence.
A numerical measurement used to predict the chances of a business going bankrupt in the next two years
Altman’s Z-Score model is a numerical measurement that is used to predict the chances of a business going bankrupt in the next two years. The model was developed by American finance professor Edward Altman in 1968 as a measure of the financial stability of companies.
Altman’s Z-score model is considered an effective method of predicting the state of financial distress of any organization by using multiple balance sheet values and corporate income. Altman’s idea of developing a formula for predicting bankruptcy started at the time of the Great Depression, when businesses experienced a sharp rise in incidences of default.
The Z-score model was introduced as a way of predicting the probability that a company would collapse in the next two years. The model proved to be an accurate method for predicting bankruptcy on several occasions. According to studies, the model showed an accuracy of 72% in predicting bankruptcy two years before it occurred, and it returned a false positive of 6%. The false-positive level was lower compared to the 15% to 20% false-positive returned when the model was used to predict bankruptcy one year before it occurred.
When creating the Z-score model, Altman used a weighting system alongside other ratios that predicted the chances of a company going bankrupt. In total, Altman created three different Z-scores for different types of businesses. The original model was released in 1968, and it was specifically designed for public manufacturing companies with assets in excess of $1 million. The original model excluded private companies and non-manufacturing companies with assets less than $1 million.
Later in 1983, Altman developed two other models for use with smaller private manufacturing companies. Model A Z-score was developed specifically for private manufacturing companies, while Model B was created for non-publicly traded companies. The 1983 Z-score models comprised varied weighting, predictability scoring systems, and variables.
The Z-score model is based on five key financial ratios, and it relies on the information contained in the 10-K report. It increases the model’s accuracy when measuring the financial health of a company and its probability of going bankrupt.
The Altman’s Z-score formula is written as follows:
Where:
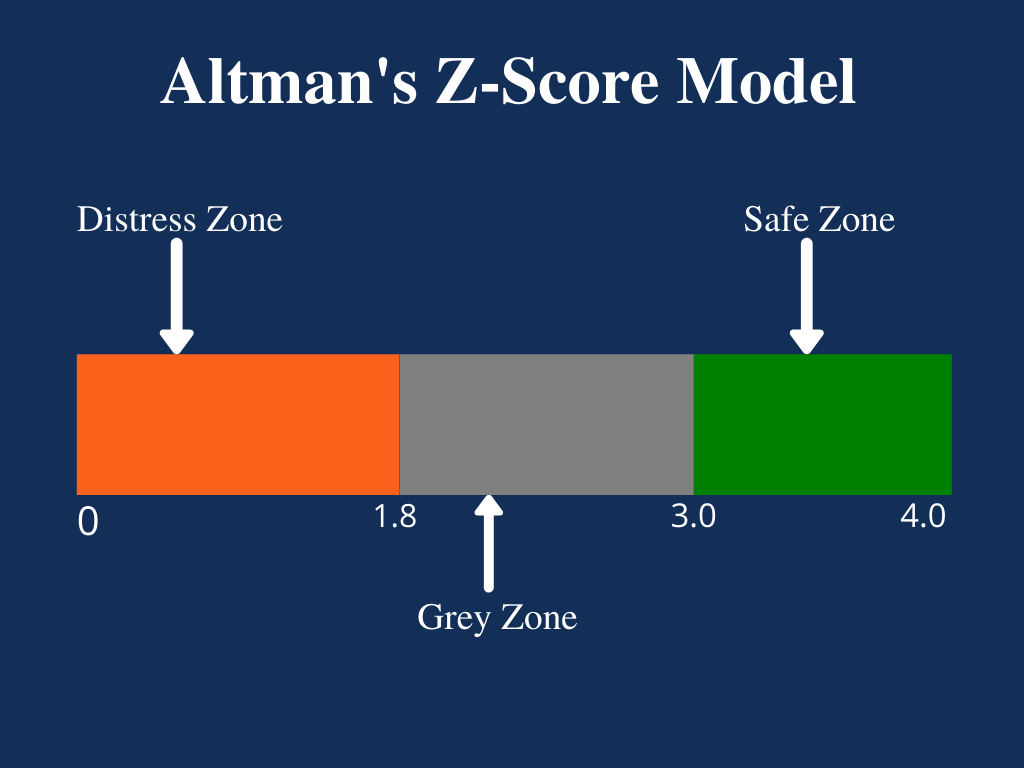
Usually, the lower the Z-score, the higher the odds that a company is heading for bankruptcy. A Z-score that is lower than 1.8 means that the company is in financial distress and with a high probability of going bankrupt. On the other hand, a score of 3 and above means that the company is in a safe zone and is unlikely to file for bankruptcy. A score of between 1.8 and 3 means that the company is in a grey area and with a moderate chance of filing for bankruptcy.
Investors use Altman’s Z-score to decide whether to buy or sell a company’s stock based on its financial strength. If a company shows a Z-score closer to 3, investors may consider buying its stock, as there is minimal risk of bankruptcy over the next 2 years.
However, if a company shows a Z-score closer to 1.8, the investors may consider selling the company’s stock to avoid losing their investments since the score implies a high probability of going bankrupt.
The following are the key financial ratios that make up the Z-score model:
Working capital is the difference between the current assets of a company and its current liabilities. The value of a company’s working capital determines its short-term financial health. A positive working capital means that a company can meet its short-term financial obligations and still make funds available to invest and grow.
In contrast, negative working capital means that a company will struggle to meet its short-term financial obligations because there are inadequate current assets.
The retained earnings/total assets ratio shows the amount of retained earnings or losses in a company. If a company reports a low retained earnings to total assets ratio, it means that it is financing its expenditure using borrowed funds rather than funds from its retained earnings. It increases the probability of a company going bankrupt.
On the other hand, a high retained earnings to total assets ratio shows that a company uses its retained earnings to fund capital expenditure. It shows that the company achieved profitability over the years, and it does not need to rely on borrowings.
EBIT, a measure of a company’s profitability, refers to the ability of a company to generate profits solely from its operations. The EBIT/Total Assets ratio demonstrates a company’s ability to generate enough revenues to stay profitable and fund ongoing operations and make debt payments.
The market value, also known as market capitalization, is the value of a company’s equity. It is obtained by multiplying the number of outstanding shares by the current price of stocks.
The market value of the equity/total liabilities ratio shows the degree to which a company’s market value would decline when it declares bankruptcy before the value of liabilities exceeds the value of assets on the balance sheet. A high market value of equity to total liabilities ratio can be interpreted to mean high investor confidence in the company’s financial strength.
The sales to total assets ratio shows how efficiently the management uses assets to generate revenues vis-à-vis the competition. A high sales to total assets ratio is translated to mean that the management requires a small investment to generate sales, which increases the overall profitability of the company.
In contrast, a low or falling sales to total assets ratio means that the management will need to use more resources to generate enough sales, which will reduce the company’s profitability.
Connect what you just learned to a clear career path with CFI’s role‑based courses and certification programs.
Thank you for reading CFI’s guide to Altman’s Z-Score Model. To keep learning and advancing your career, the following resources will be helpful:


