Phillips Curve
Graph of the short-term relationship between unemployment and inflation
What is the Phillips Curve?
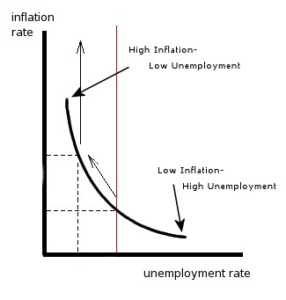
The Phillips Curve is the graphical representation of the short-term relationship between unemployment and inflation within an economy. According to the Phillips Curve, there exists a negative, or inverse, relationship between the unemployment rate and the inflation rate in an economy.
History of the Phillips Curve
In 1958, Alban William Housego Phillips, a New-Zealand born British economist, published an article titled “The Relationship between Unemployment and the Rate of Change of Money Wages in the United Kingdom, 1861-1957” in the British Academic Journal, Economica. In the article, A.W. Phillips showed a negative correlation between the rate of unemployment and the rate of inflation – the years with high unemployment showed low inflation, and the years with low unemployment experienced high inflation.
In 1960, American economists Paul Samuelson and Robert Solow published an article titled “Analytics of Anti-Inflation Policy” in the American Economic Review (AER). This article, too, reported a negative correlation between inflation and unemployment in the United States. Subsequently, researchers from other countries also found that Phillips’ discovery extended beyond the economy of the United Kingdom. Samuelson and Solow named the relation after A.W. Phillips. In 2001, George Akerlof, in his Nobel Prize acceptance speech, said, “Probably the single most important macroeconomic relationship is the Phillips Curve.”
Importance of the Phillips Curve
After the publication of “The General Theory” by John Maynard Keynes, most economists and policymakers believed that in order for the economy to grow, aggregate demand must be increased in the market. However, if policymakers stimulated aggregate demand using monetary and fiscal policy, the rise in employment and output was accompanied by a rapidly increasing price level. If policymakers then wanted to reduce inflation, then they would need to reduce output and employment in the short run.
In “Analytics of Anti-Inflation Policy,” Samuelson and Solow pointed out that Phillips Curve could be utilized as a tool by policymakers. The Phillips Curve shows the various inflation rate-unemployment rate combinations that the economy can choose from. After policymakers choose a specific point on the Phillips Curve, they can use monetary and fiscal policy to get to that point.
Example (chart)
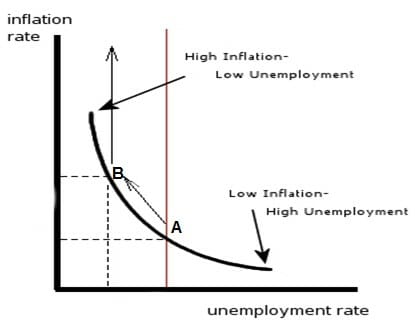
Point A represents a situation where the economy faces high unemployment but low inflation. Policymakers make the decision that the economy must prioritize output. Thus, the policymakers raise government spending and cut taxes to stimulate demand in the market. As a result of these policies, employment and output increase within the economy. However, there is a limit to how much the output can be increased. After this limit is reached, any increase in demand in the market leads to inflation. Such a situation is represented by point B. At point B, the economy faces low unemployment but high inflation.
In an ideal world, policymakers would like a situation where both unemployment and inflation are low. However, according to historical data studied by Phillips, Samuelson, and Solow, this is impossible.
The Long-term Phillips Curve
In 1968, the Nobel Prize-winning economist and the chief proponent of monetarism, Milton Freidman, published a paper titled “The Role of Monetary Policy.” In his paper, Freidman claimed that in the long run, monetary policy could not lower unemployment by raising inflation. Freidman’s claim was heavily influenced by the classical macroeconomic theory that believed that the amount of money in an economy (the money supply) was a nominal variable and could not influence a real variable such as employment or output.
In 1970, another Nobel Prize-winning economist, Edmund Phelps, published an article called “Microeconomic Foundations of Employment and Inflation Theory,” which denied the existence of any long-term trade-off between inflation and unemployment.
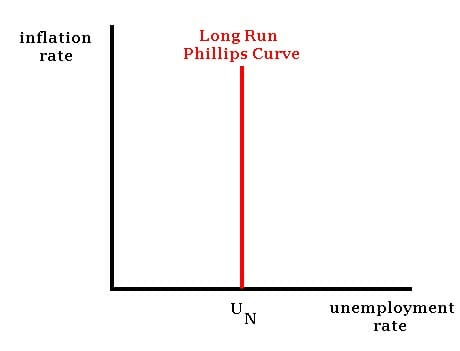
The Friedman-Phelps Phillips Curve is said to represent the long-term relationship between the inflation rate and the unemployment rate in an economy. The Freidman-Phelps Phillips Curve is vertical and settles at what is known as the natural rate of unemployment.
The Natural Rate of Unemployment refers to the unemployment rate towards which the economy moves in the long term. The Natural Rate of Unemployment is a dynamic and positive concept. Thus, it changes with time. In addition, the Natural Rate of Unemployment may not be the socially optimal level of unemployment.
Related Reading
CFI is the official provider of the global Financial Modeling & Valuation Analyst (FMVA)® certification program, designed to help anyone become a world-class financial analyst. To continue learning and advance your career, see the following free CFI resources:


