Consumer Surplus Formula

"Savings" received by the consumers

Over 2 million + professionals use CFI to learn accounting, financial analysis, modeling and more. Unlock the essentials of corporate finance with our free resources and get an exclusive sneak peek at the first module of each course. Start Free

How to Calculate Consumer Surplus

Consumer surplus is an economic measurement to calculate the benefit (i.e., surplus) of what consumers are willing to pay for a good or service versus its market price. The consumer surplus formula is based on an economic theory of marginal utility. The theory explains that spending behavior varies with the preferences of individuals. Since different people are willing to spend differently on a given good or service, a surplus is created. This metric is used across a wide range of corporate finance careers.

Consumer Surplus Experience - Woman with shopping bags

Consumer Surplus Formula

There is an economic formula that is used to calculate the consumer surplus by taking the difference between the highest consumers would pay and the actual price they pay.

Here is the formula for consumer surplus:

Consumer Surplus Formula

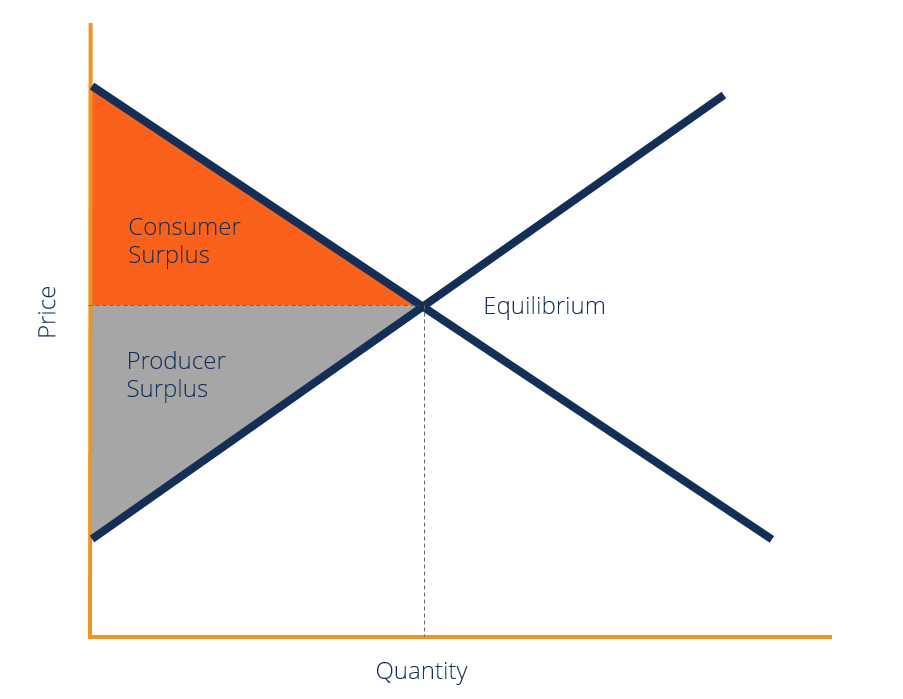
Consumer Surplus Chart with Quantity on X-axis and Price on the Y-axis

In Practice 

Here is an example to illustrate the point. A shopper is determined to buy a laptop with a 1.9GHz CPU and a 15″ screen and is willing to spend up to $1,000. As she browses through various electronics stores, she finds one for $600 that meets all her exact criteria (1.9GHz CPU and a 15″ screen), saving her $400 compared to what she was willing to spend. The $400 is her consumer surplus, which she can now save or spend on other goods or services.

Consumer Surplus on a Larger Scale

Demand curves are highly valuable in measuring consumer surplus in terms of the market as a whole. A demand curve on a demand-supply graph depicts the relationship between the price of a product and the quantity of the product demanded at that price. Due to the law of diminishing marginal utility, the demand curve is downward sloping. The orange shaded part in the illustrated graph presented above represents the consumer surplus.

Extended Consumer Surplus Formula

Extended Consumer Surplus Formula

Where:

  • Qd = Quantity demanded at equilibrium, where demand and supply are equal
  • ΔP = Pmax – Pd
  • Pmax = Price the buyer is willing to pay
  • Pd = Price at equilibrium, where demand and supply are equal

Producer Surplus

On the other side of the equation is the producer surplus. As you will notice in the chart above, there is another economic metric called the producer surplus which is the difference between the minimum price a producer would accept for goods/services and the price they receive.

In a perfect world, there may be an equilibrium price where both consumers and producers have a surplus (i.e., they are both better off, as opposed to a situation where only one side benefits).

Practical Applications  

In a theoretical market for bottled water, a customer is willing to pay $10 for the bottled water, which is the highest among other customers. Most customers are only willing to pay $5, which is coincidentally the price that is set when demand meets supply exactly. At $5, 20 bottles are supplied, and the consumer surplus is $50. It means that – shared among the customers who bought the 20 bottles of water – there are $50 in savings that can go towards other purchases.

More Economic Resources

We hope this has been a helpful guide to the consumer surplus formula. To learn about more important economic principles, please see our related articles and guides below:

0 search results for ‘