Get Certified for Financial Modeling (FMVA)®
Gain in-demand industry knowledge and hands-on practice that will help you stand out from the competition and become a world-class financial analyst.
The total amount of debt held by households compared to the disposable income (after-tax income) of the households
The credit-market debt to disposable income ratio is a financial metric used to measure financial conditions in households. The ratio compares the total amount of debt held by households to the disposable income (after-tax income) of the households. The credit-market debt to disposable income ratio is also called the household debt to disposable income ratio.

Where:
There are five households in Country A. Each household’s credit-market debt and disposable income are shown below. What is the credit-market debt to disposable income for Country A?
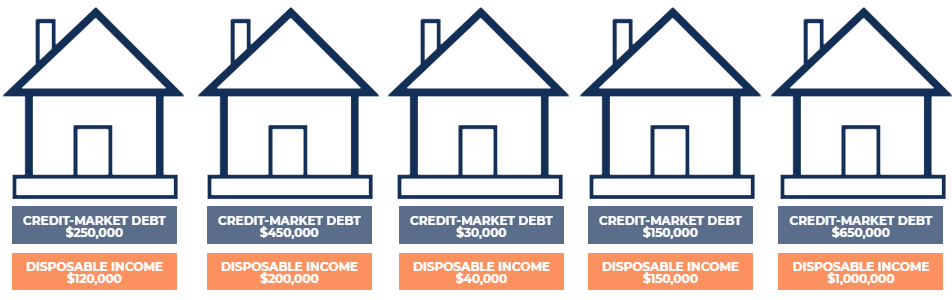
To determine the credit-market debt to disposable income ratio for Country A, we add the credit-market debt across all households and divide it by the sum of disposable income across all households. The calculations are shown below:
Total Credit-Market Debt = $250,000 + $450,000 + $30,000 + $150,000 + $650,000 = $1,530,000
Total Disposable Income = $120,000 + $200,000 + $40,000 + $150,000 + $1,000,000 = $1,510,000
Credit-Market Debt to Disposable income Ratio = $1,530,000 / $1,510,000 x 100 = 101.32%
The credit-market debt to disposable income ratio measures the ability of households to manage their existing debt from their disposable income. The ratio can be interpreted as the dollar amount of credit market debt per dollar of household disposable income. In the example above, households in Country A carry a credit market debt of $1.01 per dollar of disposable income.
A higher ratio is often seen as undesirable and risky. The higher the ratio, the more susceptible households are to adverse changes in economic conditions. To illustrate the fact, consider the two scenarios below:
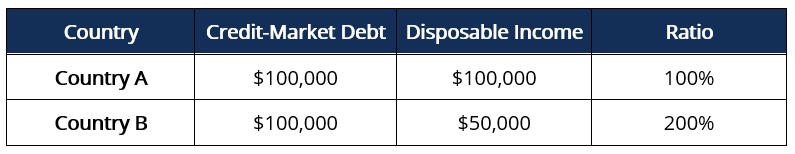
For simplicity, assume that debt in both countries bears a 5% annual interest rate on the total outstanding credit-market debt and that all households in both countries are homogenous. As such, households in Country B would face a greater credit risk as they would see a relatively lower disposable income to service their interest payments.
The increased interest payment burden may cause households to (1) reduce consumption and spending, (2) decrease their savings, or (3) lower their principal repayment amount. This would result in an adverse impact on the economy, as reduced consumption and spending would slow down the economy.
In the backdrop of increasing interest rates, a high ratio is concerning to see – the increasing interest rates may push households to default on their debt. Therefore, policymakers pay close attention to the ratio when setting interest rate policies.
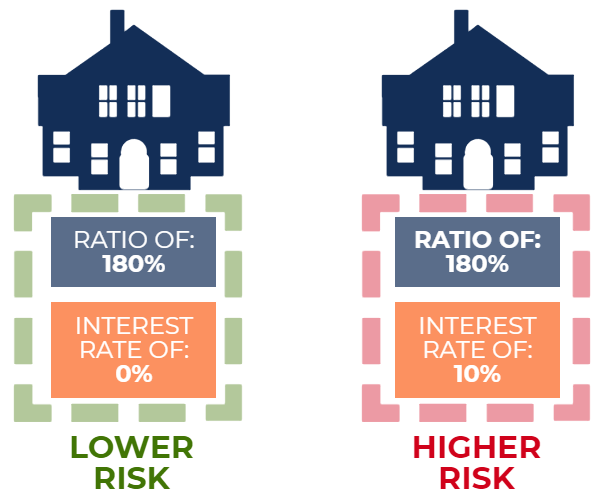
To conclude, the ratio is a measure of the relative financial vulnerability of households. A higher ratio indicates higher household credit risk, while a lower ratio indicates lower household credit risk. The ratio must be taken into consideration with current macroeconomic conditions to determine whether the ratio is concerning or not.
For example, a country with a ratio of 180% with a 0% interest rate environment would be significantly less worrying than another country with a ratio of 180% but in a 10% interest rate environment.