Income Effect
The change in the demand for a good as a result of a change in the income of a consumer
What is the Income Effect?
Income effect refers to the change in the demand for a good as a result of a change in the income of a consumer. It is important to note that we are only concerned with relative income, i.e., income in terms of market prices.

Example of Income Effect
Consider the following example: John earns $1,000 a month and spends his entire income on only two commodities, apples (priced at $1 each) and cheese (priced at $5). We can make the following statements about John’s income:
- John earns 1,000 units of apples a month.
- John earns 200 units of cheese a month.
Therefore, a 100% increase in John’s monthly income ($1,000 to $2,000) results in the same effect as a 50% decrease in all prices (the apple’s price falls from $1 to $0.50 and the cheese’s price from $5 to $2.50). In both cases, we can make the following statements about John’s income:
- John earns 2,000 units of apples a month.
- John earns 400 units of cheese a month.
Analyzing the Income Effect Using an Indifference Map
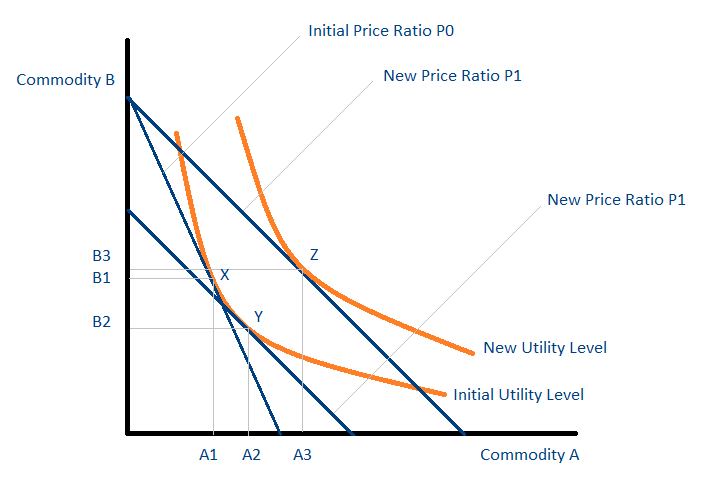
The graph above is known as an indifference map. Each point on an orange curve (known as an indifference curve) gives consumers the same level of utility. The initial price ratio is P0. It is the price of commodity B in terms of commodity A and is known as the relative price of commodity B in terms of commodity A. The consumer initially consumes at point X and consumes A1 units of A and B1 units of B.
Consider now the effect of a fall in the price of commodity A from P0 to P1. As a result of the price change, commodity B is now relatively more expensive in terms of commodity A, and commodity A is now relatively less expensive in terms of commodity B. The substitution effect measures the change in consumption such that the consumer’s level of utility does not change. It can, therefore, be thought of as a movement along the same indifference curve. The substitution effect results in a change in consumption from point X to point Y.
The consumption of commodity A increases from A1 to A2, and the consumption of commodity B decreases from B1 to B2. Points X and Y give the consumer the same level of utility as they lie on the same indifference curve. It is important to note that Y is not the final point of consumption. At point Y, the consumer possesses unused income, which can be used to increase consumption.
The increase in consumption from point Y to point Z is due to the income effect. The consumption of commodity A increases from A2 to A3 and the consumption of commodity B increases from B2 to B3. As can be seen from the graph, the consumption of both commodities is higher at point Z compared to point X. The situation occurs as both commodities A and B are normal goods and show positive income effects.
Related Readings
CFI is the official provider of the global Financial Modeling & Valuation Analyst (FMVA)® certification program, designed to help anyone become a world-class financial analyst. To keep advancing your career, the additional CFI resources below will be useful:


