Utility Theory

Describing investors' relationship with risk

Over 2 million + professionals use CFI to learn accounting, financial analysis, modeling and more. Unlock the essentials of corporate finance with our free resources and get an exclusive sneak peek at the first module of each course. Start Free

What is Utility?

In the field of economics, utility (u) is a measure of how much benefit consumers derive from certain goods or services. From a finance standpoint, it refers to how much benefit investors obtain from portfolio performance.

While it may be intuitive to assume that all investors would like to achieve very high returns, it is important to realize that such returns typically require the investor to take on a lot of risks. Risk and return are trade-offs and follow a linear relationship. High-risk investments present a high likelihood of an investor losing all his/her money. Having a solid understanding of one’s u of money can help investors make investment decisions that are more suited to their risk attitudes and investment strategies.

Utility

How is Utility Measured?

Since the u scale varies greatly between individuals, and as individuals have different functions, it is quite difficult to quantify u. However, it is sometimes possible to use dollars as a quantitative measure of u. Consider the following example:

Ben is considering buying a new house. After conducting extensive research, Ben has narrowed down his options to the following:

Utility example

From a value standpoint, Home B is a better deal since it provides more benefit as a standalone entity. However, Ben works downtown and thus decides to pay $2 million for Home A instead. In such a case, we can say that Ben’s utility of living downtown is $1.5 million (the premium over Home B).

There may be many people like Ben that would pay a large premium to live in a certain area. In such cases, studies can be conducted to further understand consumer behavior and draw additional insights.

Marginal Utility

Marginal utility refers to how much incremental an individual derives from obtaining one additional unit of a certain good or service. Consumers derive decreasing marginal from goods and services available in an economy. This means that after having a certain amount of a particular good or service, the of acquiring one more unit of the good/service falls.

A recent study has found that people earning $95,000 per year derive just as much from their salary as people earning $200,000 per year. This illustrates the concept of decreasing marginal u; after $95,000, individuals begin to value other things (such as time) much more than money.

Types of Utility Curves

Generally speaking, there are three types of utility curves that explain the relationship investors have with risk.

Type I – Risk Averse

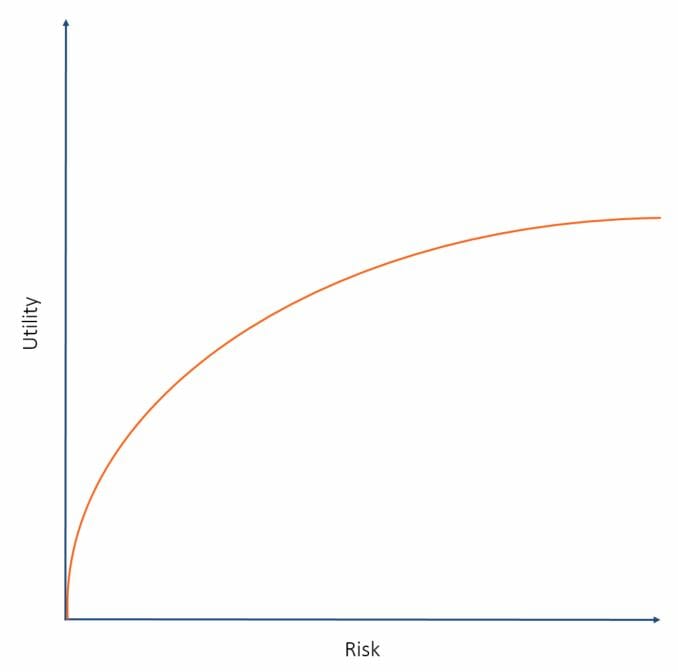
This type of utility trend is what most individuals experience, according to the study cited above. From a conceptual standpoint, graphing this type of utility would give us the following:

risk averse

As the investor takes on more risk (and thus the possibility of greater returns), they will start to have a smaller and smaller desire to take on further risk.

Type II – Risk Neutral

This attitude towards risk would be perfectly linear and not face changes in marginal utility. The graph below illustrates this relationship:

Risk neutral

In practice, such an investor would continuously take on more risk since this will result in more utility. This type of investing behavior is quite rare.

Type III – Risk Loving

This attitude towards risk would be exponential, meaning that this investor experiences increasing marginal utility. The graph below illustrates this relationship:

risk loving

More Resources

CFI offers the Capital Markets & Securities Analyst (CMSA®) certification program for those looking to take their careers to the next level. To learn more about related topics, check out the following CFI resources:

0 search results for ‘