Get Certified for Financial Modeling (FMVA)®
Gain in-demand industry knowledge and hands-on practice that will help you stand out from the competition and become a world-class financial analyst.
Evaluating a company's financial health using the balance sheet
Reading a balance sheet is important in determining the financial health of a company. The balance sheet, also known as the statement of financial position, is one of the three key financial statements. It summarizes a company’s financial position at a point in time. The balance sheet is unlike the other key financial statements that represent the flow of money through various accounts across a period of time.
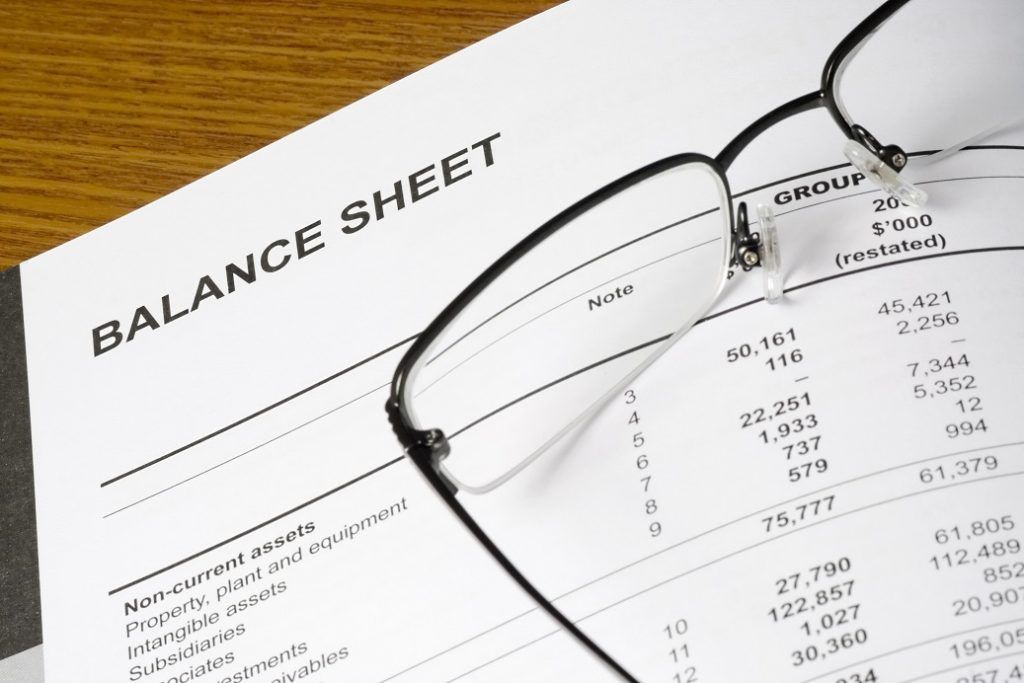
The balance sheet is often considered the most important of the three statements, as it can be used to determine the health and durability of a business. For example, when doing credit analysis, a lender studies the strength of the balance sheet before determining if the cash flows are enough to service the debt. Hence, there is a constant focus on maintaining a strong and healthy balance sheet.
The next sections describe the structure of the balance sheet and how to read different parts of the balance sheet. They also discuss the important relationships between the other statements and the balance sheet, as well as how to read the notes.
The balance sheet has four major sections – Assets, Liabilities, Shareholder’s Equity, and Notes. Each of the first three sections contains the balances of the various accounts under each heading. The notes section contains detailed qualitative information and assumptions made during the preparation of the balance sheet.
More details about the structure of the balance sheet and its relationship to the other financial statements can be found in the free CFI course on Reading Financial Statements.
The assets section of the balance sheet contains the asset accounts of the business. They are accounts that lead to the generation of future cash inflows like accounts receivable or are used in the business like property, plant, and equipment (PP&E). The section is further subdivided into two parts – Current Assets and Non-Current Assets.
Current Assets: These are assets with an accounting life of less than one year. They include accounts like accounts receivable, inventory, cash and cash equivalents, and advances. The current assets form the basis of the working capital of the company. The current assets section is often reviewed in conjunction with the current liabilities section of the balance sheet.
While reading the current assets section of the balance sheet, it is important to check for asset overstatement, such as large accounts receivable due to an improper allowance for doubtful accounts. Further quality of assets cannot be directly determined using the balance sheet alone.
Continuing with the accounts receivable example, the quality of receivables can often be found in the notes to the balance sheet, which breaks down the receivables by age and credit quality. Older receivables are likely to turn into bad debts.
The following metrics can be used to analyze the current assets of a company:
Non-Current Assets: These are assets with a useful life of more than one year. They include accounts like the property, plant equipment, land, goodwill. They are the company’s assets that are used to generate revenues and drive the primary business activity. It is important to read the non-current assets section in relation to the notes and the income statement.
For example, the section includes property, plant, and equipment, which must be read in conjunction with notes about the depreciation policy. The notes to the balance sheet, as well as the cash flow statement, also detail the changes in fixed assets like PP&E. The changes are not clearly reflected in the balance sheet. The notes may also detail the breakdown of assets in the PP&E account and their useful lives.
Goodwill is often a large portion of the total assets of a firm. It is an intangible asset that arises primarily from acquisitions. Goodwill is checked for impairment every year and is written-off when it is no longer valuable. Details about the value of goodwill and its components are listed in the notes to the balance sheet. Since goodwill impairment is a value judgment, it is important to read the goodwill with notes section of the balance sheet.
The following metrics can be used to analyze non-current assets:
The liabilities section of the balance sheet contains the liability accounts of the business. These are the obligations of the business to outside parties that arise from usual business operations and financing activities. This section is also divided into two subsections – Current Liabilities and Non-Current Liabilities.
Current Liabilities: These are liabilities that are due in less than a year. The current liabilities section contains accounts like accounts payable, unearned income, current portion of long-term debt. The section is read in conjunction with the current assets section of the balance sheet.
Current liabilities form the other end of the working capital of the business. They are the obligations that must be met using the cash flows from the current assets and other funding sources. While reading the balance sheet, it is important to study the company’s short-term obligations to check for any liquidity issues that may arise in the near term.
The following metrics can be used to analyze the current liabilities of a company:
Non-Current Liabilities: These are liabilities with an accounting life of more than one year. Typically, the non-current liabilities section includes items such as long-term debt, lease obligations. The section is important, as it forms one part of a company’s capital structure and is essential in major analyses, such as valuation and credit analysis.
The section’s most important part is long-term debt. The long-term debt number on the balance sheet is an aggregate number, which pools all the debt issued by the company. The details of the figure are found in the notes section, which breaks down the debt by issuance. The note provides important details like maturity, interest rate, and other terms of debt. The information is essential to evaluate the capital structure and perform credit analysis if new debt needs to be issued.
Following metrics can be used to analyze non-current liabilities:
The final major section of the balance sheet is shareholder’s equity. This section summarizes the value that accrues to the equity holders in the business. It includes accounts such as paid-up capital via different classes of stock like common stock and preferred stock, retained earnings, accumulated other comprehensive income, contributed surplus, etc.
The shareholder’s equity section is essential from the point of view of valuation. Often, financial statements will include a separate statement detailing the changes in shareholder equity. The paid-up capital is usually the largest item here. It is the amount raised from equity holders by issuing shares in the business.
The other items of importance are retained earnings and other comprehensive income. Retained earnings are the portion of the net income retained in the business for future use after the distribution of dividends. Another comprehensive income is the income generated from a source not directly related to the primary business activity. A typical example of such income is the income generated from hedging activities and other financial instruments.
Other comprehensive income is not the most transparent figure. It is important to dig deeper into the figure as well. Many of the financial instruments that contribute to other income are not listed on the balance sheet. They are instead described in the notes. It is important to understand the details of such financial exposures, as many of the instruments are complex, and the balance sheet number is often based on modeling assumptions.
The price-to-book ratio is a metric that can be used to analyze the shareholders’ equity section.
The following is an example of analyzing a real-world balance sheet. The data comes from the financial statements of Western Forest Products (WEF), a lumber company based out of British Columbia, Canada. The analysis that follows goes over the important accounts on the balance sheet and presents a quantitative analysis that can help measure the quality of the balance sheet in a way that makes it comparable to the balance sheets of other companies.
Some of the relevant accounts for Western Forest Products are discussed below.
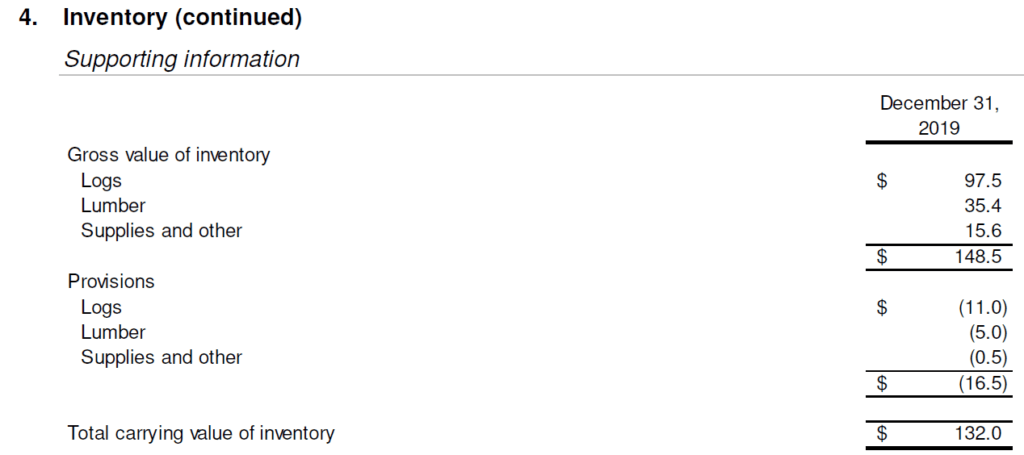
WEF is in the business of selling lumber, which means that most of its revenues are driven by the value of the lumber they sell. Hence it is important to read the details of how they carry their inventory. According to the balance sheet notes, the inventory is carried at the lower of cost and net realizable value (NRV).
Since timber is an actively traded commodity, it comes with an observable price that can be used to value the inventory. The above information also highlights one of the major risks of the business that the revenue is sensitive to market movements. The notes also give the breakdown of the inventory as illustrated in the table below:
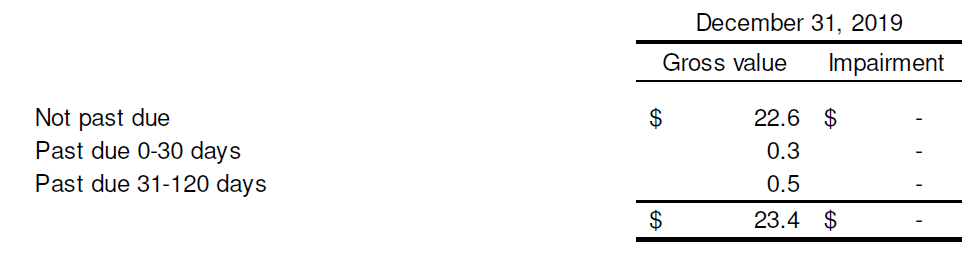
Receivables form an important part of WEF’s balance sheet, as they represent sources of cash flow. The cash flow is necessary to meet the company’s short-term obligations. Though the balance sheet does not include an exclusive note for receivables, the note regarding financial instruments gives a breakdown of receivables by age. Based on the note, only about 3.5% of receivables in 2019 were late, which indicates the high quality of receivables.
The biological assets section is the most unique item in the balance sheet of WEF. Biological assets are the forest land owned by the company for timber production. The asset is carried at fair value on the balance sheet, which means that number is subjective. It is important, and its valuation details are covered in the notes. The details can be a useful guide to revaluing the assets during analysis.
WEF carries a long-term debt of about $114 million on its books. The nature of the long-term debt is again made clear in the notes. According to the notes, the company drew from a $250 million credit facility.
Furthermore, the interest rate on the debt is 5.45%, which is higher than the 4.56% rate in the previous year. It indicates increased credit risk in the business, which is clearly evident from the increased debt-to-capital ratio.
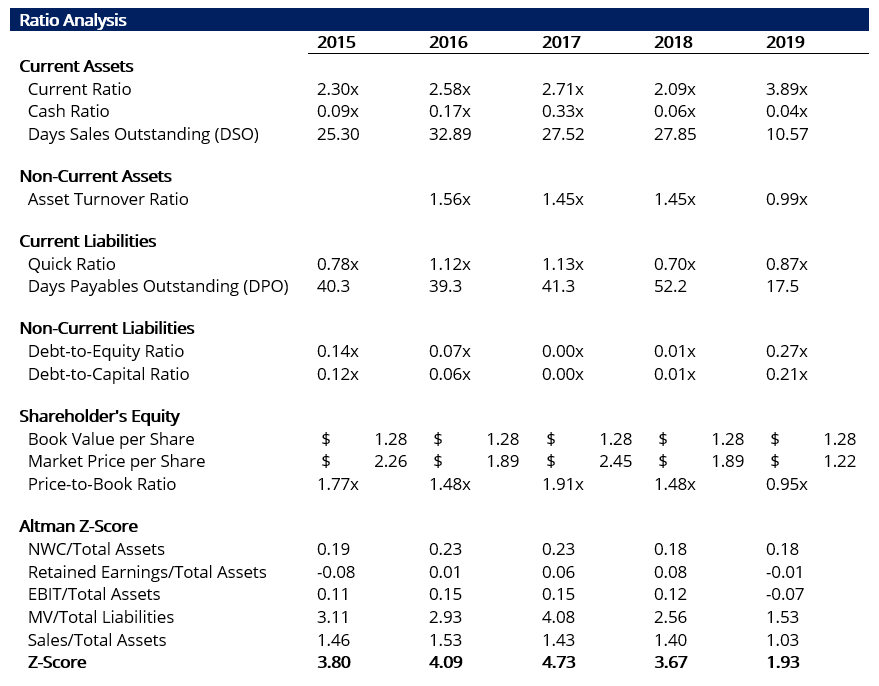
A detailed reading of the balance sheet is incomplete without quantitative analysis. Ratio analysis of the balance sheet is a good first step in determining the health of the underlying business. Ratio analysis can then be augmented with more complex analyses like the Altman Z-Score. The analysis goes over various sections of WEF’s balance sheet and performs suitable analyses.
According to the analysis, there was a deterioration in business performance in 2019. It is reflected by changes in the following list of ratios:
Finally, the Altman Z-Score can be used as a summary figure for the quality of the balance sheet. In 2019, it fell to 1.93 from a health score of 3.67. The figure indicates the company is borderline bankrupt and is clearly a distressed business, according to the Z-Score analysis. The following table summarizes the results of the analysis:
To keep learning and developing your knowledge base, please explore the additional relevant resources below:


