Get Certified for Financial Modeling (FMVA)®
Gain in-demand industry knowledge and hands-on practice that will help you stand out from the competition and become a world-class financial analyst.
Designing a forecasted income statement
When building a three statement model, it becomes necessary to get into the habit of projecting income statement line items. Being able to project the main line items of the income statement should become second nature. Each specific line item will have drivers that impact their future values. In fact, if a specific financial model you are using is similar to another company that you need to model, you may even be able to copy the model directly, and simply replace the historical values.
The following are the main accounts that need to be covered when projecting income statement line items:
By including all of the above (and more, if necessary), you can arrive at net income, or the bottom line of the income statement.
Below is a screenshot from one of CFI’s financial modeling courses of the main drivers of an income statement forecast.
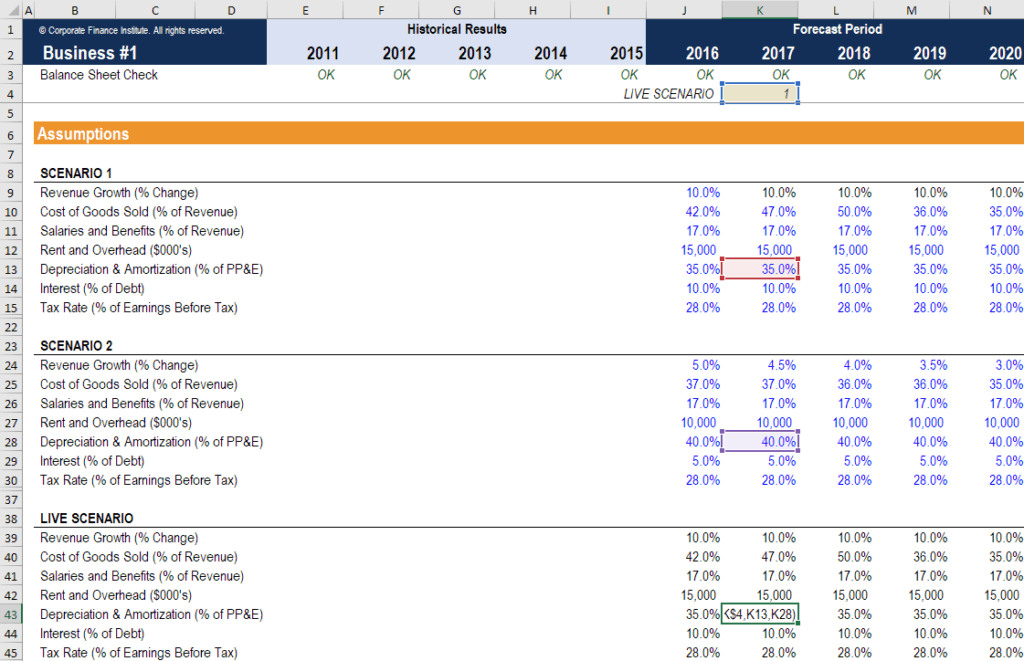
Source: CFI’s financial modeling courses.
Projecting income statement line items naturally begins with the top of the income statement. This is the sales revenue. All subsequent line items will usually be based on the sales revenue value.
Sales revenue can be forecasted in several different ways. First, you can model sales revenue as a simple growth rate from previous years. This means that any subsequent year is the past year’s sales revenue multiplied by one plus the growth rate.
Second, you can model sales revenue as a factor of GDP or some other macroeconomic peg/metric. This means that revenue for each year will depend on a regression formula based on historic sales revenue and the input of that year’s GDP (or other metric).
Finally, you can model sales revenue as a simple dollar value. This method of forecasting is the least dynamic and, usually, the least accurate. However, it is available when quick and dirty sales revenue forecasts are needed.
The next step is to forecast Cost of Goods Sold. By doing so, we can subtract COGS from revenue to find Gross Profit. Alternatively, Gross Profit can be forecast, and then we can mathematically find Cost of Goods Sold.
Regardless of which line item we choose to forecast, the method is simple. Most of the time, the simple percentage of sales revenue method will suffice. We take past figures of Cost of Goods Sold (or gross profit) over sales revenue and use these percentages to predict future percentages.
Alternatively, a more robust model may model out specific cost of goods items. These may be split into raw material, work in progress, finished goods, labor costs, direct material costs, or some other line items, depending on business operations. These can be forecast as percentages of sales revenue as well, or by using whole dollar values.
A simple and clean model will elect to forecast the total Selling, General, and Administrative (SG&A) expense as one line item. This is easily done with the percentage of sales method. However, a more robust model may want to break out SG&A into individual components, which is a more involved method. This is because each individual line item will have different drivers.
For example, rent expense will generally be fixed every month, so a fixed dollar value will be more appropriate than a percentage of sales revenue. However, advertising expenses may be correlated with sales revenue, so, in this case, the percentage of sales may be more accurate. There may also be “one-off” line expenses that do not appear every month. We discuss this more in our article on financial statement normalization.
There are also two line expenses that sometimes appear under SG&A that need specific forecasting work. These are depreciation expense and interest expense.
Depreciation expense ties the gradual usage of machinery and PP&E to their benefit of generating revenue. Because the economic benefit (revenue) of using PP&E lasts more than one accounting period, the matching principle dictates that their expense must also be accrued over more than one accounting period.
We forecast depreciation expense through the use of a depreciation schedule. This shows us the opening balances of PP&E, any new capital expenditures, and the closing balance of PP&E. Through historic balances and CapEx, we can find historic depreciation expense. These values can then be used to predict future depreciation expense and capital expenditures.
Depreciation expense can be forecasted in the schedule using a percentage of the opening balance or any of the depreciation accounting methods. If we know the company’s depreciation policy, then we can directly apply straight-line, units-of-production, or accelerated depreciation to find the proper expense values.
Learn more about the various types of depreciation.
Interest expense is found through using the debt schedule. This schedule outlines each individual piece of debt on their own schedule, and sometimes makes a summary schedule that totals all balances and interest expense.
Interest expense is found by multiplying the opening balance in each period with the interest rate. This interest expense is then added back to the opening balance, and is then reduced by any principal repayments, to find the closing balance.
Finally, we arrive at the last line item to find tax expense. Tax expense is found as a percentage of earnings before tax (EBT). This percentage is known as the effective tax rate or cash tax rate. EBT must be found by subtracting all the previous expense line items from sales revenue. After multiplying EBT with the historical effective tax rate, we are able to forecast future tax expense.
After projecting income statement line items, the income statement is found as follows:
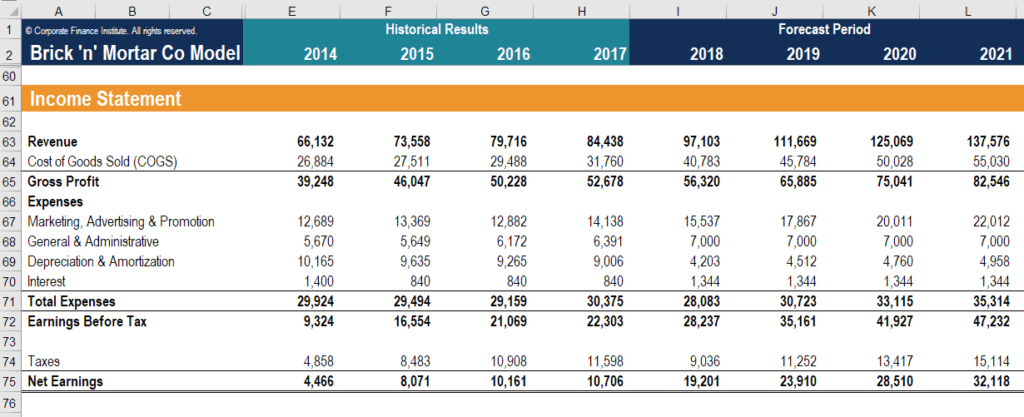
Source: CFI’s financial modeling courses.
Connect what you just learned to a clear career path with CFI’s role‑based courses and certification programs.
Through financial modeling courses, training, and exercises, anyone in the world can become a great analyst. To keep advancing your career, the additional CFI resources below will be useful:


