Get Certified for
Business Intelligence (BIDA®)
Develop analytical superpowers by learning how to use programming and data analytics tools such as VBA, Python, Tableau, Power BI, Power Query, and more.
A statistical measure of the dispersion of data points around the mean
The coefficient of variation (relative standard deviation) is a statistical measure of the dispersion of data points around the mean. The metric is commonly used to compare the data dispersion between distinct series of data. Unlike the standard deviation, which must always be considered in the context of the mean of the data, the coefficient of variation provides a relatively simple and quick tool to compare different data series.

In finance, the coefficient of variation is important in investment selection. From a financial perspective, the financial metric represents the risk-to-reward ratio, where the volatility shows the risk of an investment and the mean indicates the reward of an investment.
By determining the coefficient of variation of different securities, an investor identifies the risk-to-reward ratio of each security and develops an investment decision. Generally, an investor seeks a security with a lower coefficient (of variation) because it provides the most optimal risk-to-reward ratio with low volatility but high returns. However, the low coefficient is not favorable when the average expected return is below zero.
Mathematically, the standard formula for the coefficient of variation is expressed in the following way:

Where:
In the context of finance, we can re-write the above formula in the following way:

Fred wants to find a new investment for his portfolio. He is looking for a safe investment that provides stable returns. He considers the following options for investment:
In order to select the most suitable investment opportunity, Fred decided to calculate the coefficient of variation of each option. Using the formula above, he obtained the following results:
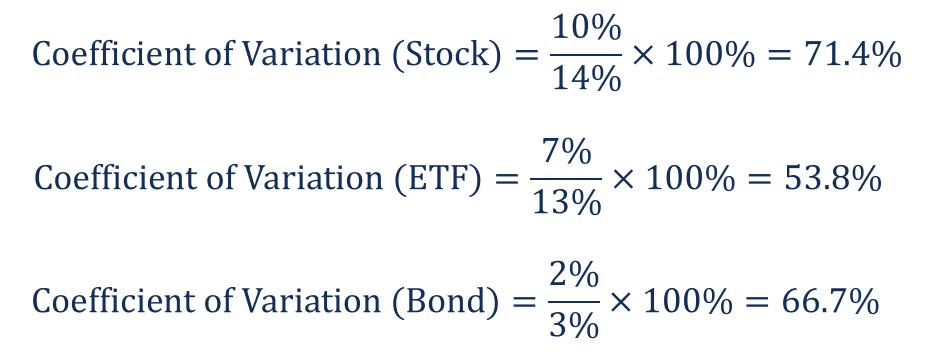
Based on the calculations above, Fred wants to invest in the ETF because it offers the lowest coefficient of variation with the most optimal risk-to-reward ratio.
Connect what you just learned to a clear career path with CFI’s role‑based courses and certification programs.
Thank you for reading CFI’s guide to the Coefficient of Variation. To keep learning and advancing your career, the following CFI resources will be helpful:


