Get Certified for
Business Intelligence (BIDA®)
Develop analytical superpowers by learning how to use programming and data analytics tools such as VBA, Python, Tableau, Power BI, Power Query, and more.
Virtually every piece of data will fall within three standard deviations of the mean
In mathematics, the empirical rule says that, in a normal data set, virtually every piece of data will fall within three standard deviations of the mean. The mean is the average of all of the numbers within the set.
The empirical rule is also referred to as the Three Sigma Rule or the 68-95-99.7 Rule because:
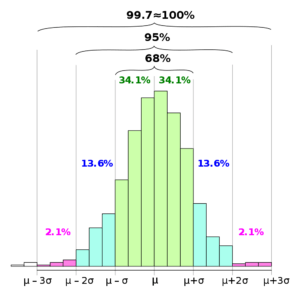
The empirical rule came about because the same shape of distribution curves continued to appear over and over to statisticians. The empirical rule applies to a normal distribution. In a normal distribution, virtually all data falls within three standard deviations of the mean. The mean, mode, and median are all equal.
This means that the mean, mode, and median should all fall at the center of the dataset. Half of the data should be at the higher end of the set, and the other half below.
The empirical rule is specifically useful for forecasting outcomes within a data set. First, the standard deviation must be calculated. The formula is given below:
The complicated formula above breaks down in the following way:
That is the standard deviation between the three primary percentages of the normal distribution, within which the majority of the data in the set should fall, excluding a minor percentage for outliers.
As mentioned above, the empirical rule is particularly useful for forecasting outcomes within a data set. Statistically, once the standard deviation’s been determined, the data set can easily be subjected to the empirical rule, showing where the pieces of data lie in the distribution.
Forecasting is possible because even without knowing all data specifics, projections can be made as to where data will fall within the set, based on the 68%, 95%, and 99.7% dictates showing where all data should rest.
In most cases, the empirical rule is of primary use to help determine outcomes when not all the data is available. It allows statisticians – or those studying the data – to gain insight into where the data will fall, once all is available. The empirical rule also helps to test how normal a data set is. If the data does not adhere to the empirical rule, then it is not a normal distribution and must be calculated accordingly.
To keep learning and advancing your career, the additional CFI resources below will be useful:


