Get Certified for
Business Intelligence (BIDA®)
Develop analytical superpowers by learning how to use programming and data analytics tools such as VBA, Python, Tableau, Power BI, Power Query, and more.
A statistical measure of central tendency
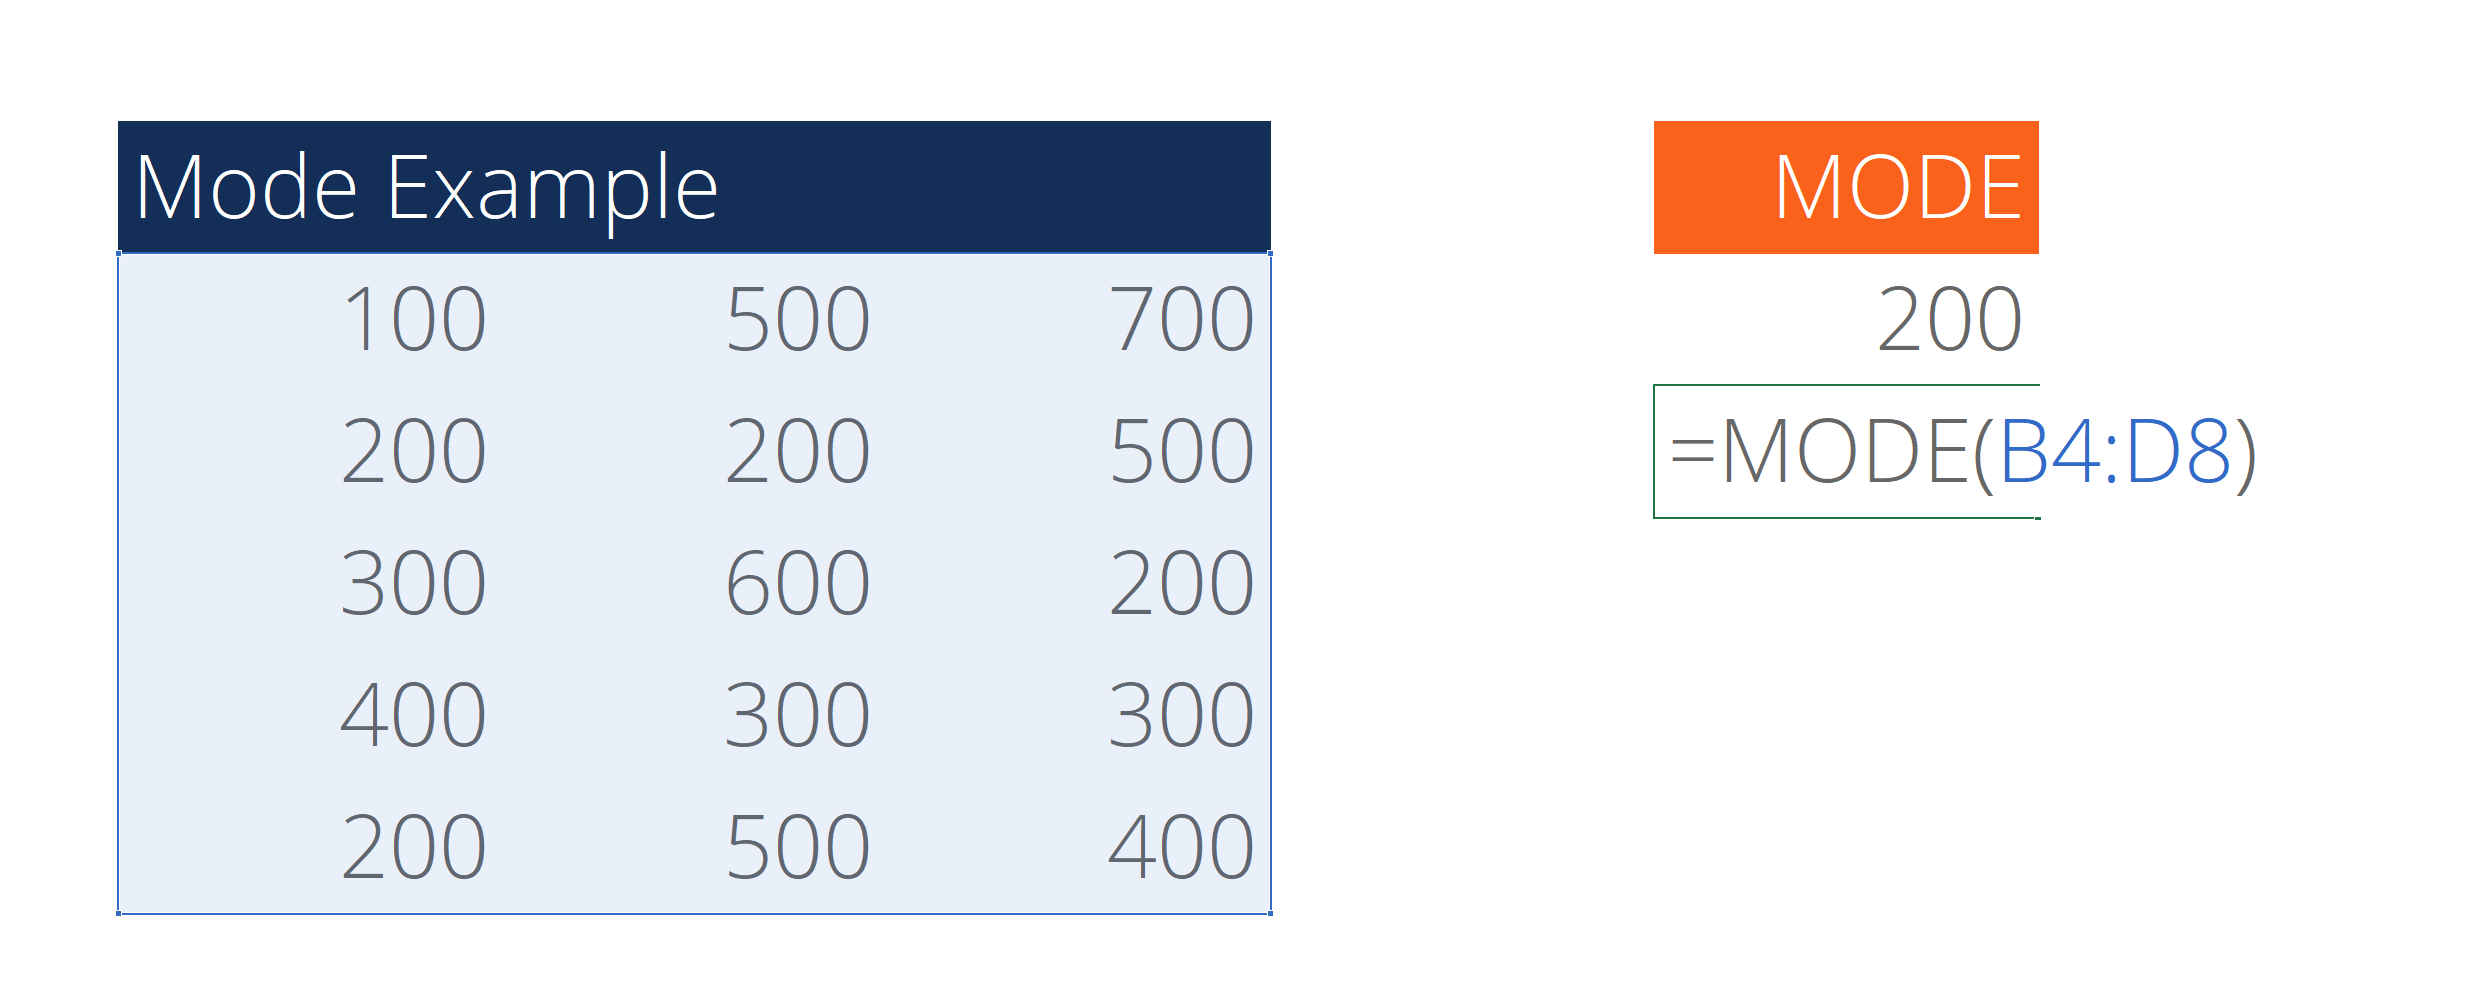
Mode is the most frequently occurring value in a dataset. Along with mean and median, mode is a statistical measure of central tendency in a dataset. Unlike the other measures of central tendency that are unique to a particular dataset, there may be several modes in a dataset.
Corporate Finance Institute reviews some of these statistical measures in our Math for Corporate Finance course.
In certain cases, mode can be an extremely helpful measure of central tendency. One of its biggest advantages is that it can be applied to any type of data, whereas both the mean and median cannot be calculated for nominal data. It is also not affected by extreme values in datasets with quantitative data. Thus, it can provide insights into almost any dataset despite the data distribution.
On the other hand, the statistical measure also comes with its own limitations. For instance, it cannot be further treated mathematically. Therefore, the measure cannot be used for more detailed analysis. In addition, since it is not based on all values in the dataset, it is difficult to draw conclusions regarding the dataset relying on mode only.
For the advantages of other statistical measures and how to calculate and use them, check out CFI’s Math for Corporate Finance course!
No calculations are necessary to find the mode. Simply follow the steps below:
In addition, it can be easily found using the distribution graph or histogram. Graphically, it is represented as the peak point on the distribution graph or the tallest bar on the histogram.
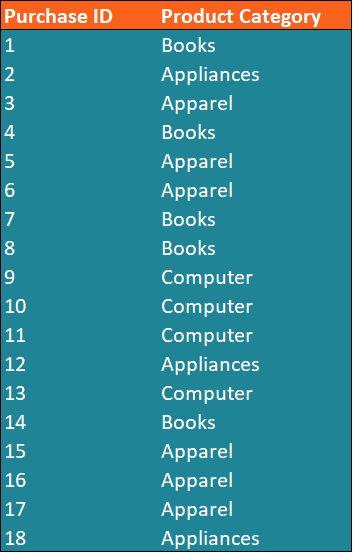
You are the financial analyst at an e-commerce company. You’ve been assigned a task to determine the most frequently purchased category of a product in the last month.
In order to complete the task, you retrieve the data of the purchases for the last month. The data is summarized in the table below:
The task can be completed by determining the mode of the product category in the dataset, which can be found using the steps below:
1. Identify the distinct values in the dataset. We can see that the distinct values of the product categories in the dataset include Apparel, Appliances, Books, and Computer.
2. Calculate the frequency of each distinct value in the dataset.
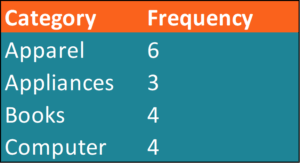
3. Determine the mode (the most frequent distinct value).
From the table above, we can see that the apparel category is the most frequent in the dataset. In other words, apparel is the mode in the dataset.
Alternatively, we can find the mode using a histogram (or other frequency distribution chart). Using our original data, we can easily create a histogram in Excel.
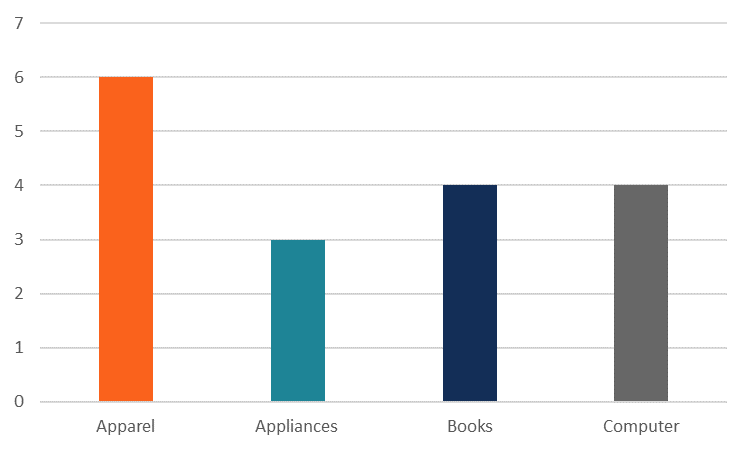
From the chart, we can clearly see that the apparel category is the mode in the dataset.
To keep learning and advancing your career, the following CFI resources will be helpful:


