Get Certified for
Business Intelligence (BIDA®)
Develop analytical superpowers by learning how to use programming and data analytics tools such as VBA, Python, Tableau, Power BI, Power Query, and more.
The graphical representation of the general function y = a*sin (bx)
A sine wave refers to the graphical representation of the general function. The sine wave comes with a characteristic “S” shape where it oscillates above and below 0 in a periodic uniform manner.
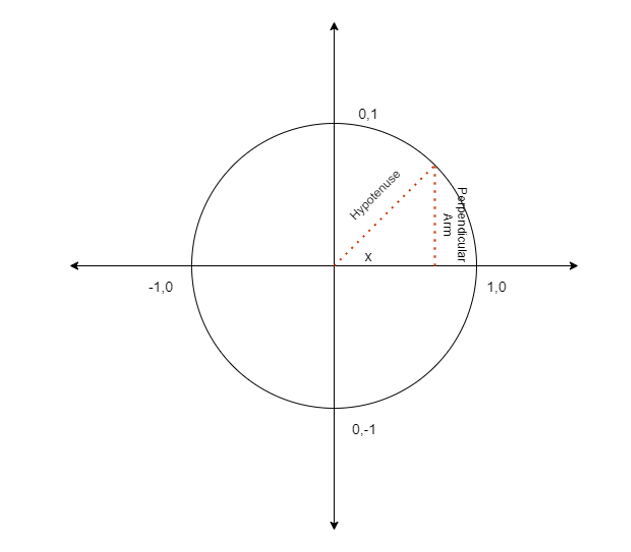
The sine function is a trigonometric function, which is a mapping from the set of all non-negative real numbers to the interval [-1,1], i.e., the sine function takes as input any non-negative real number and gives as output some number between -1 and 1. The sine function and sine waves are used to model periodic phenomena and processes that follow predictable cyclical patterns.
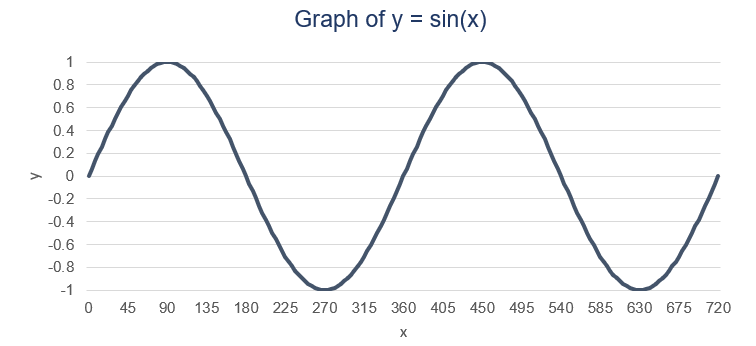
The sine function refers to the ratio of the perpendicular arm to the hypotenuse of any point in the unit circle – i.e., for any non-negative real number x, if a line is drawn from the origin to the boundary of the unit circle such that the angle between the line and the horizontal axis is x, then the sine function returns the y coordinate of that point on the boundary of the unit circle. The sine function “resets” after multiples of 360, i.e., sin(x)= sin(x+360)=sin(x+720)…
The sine function and sine waves are widely used to model economic and financial data that exhibit cyclic or periodic behavior. The variable in such modeling exercises is time.
For example, a business selling consumer discretionary goods is likely to experience strong seasonality in its sales and revenues. Consumers tend to spend more money in the lead-up to the holidays (October through March) and less money immediately after the holidays.
Similarly, macroeconomic variables such as unemployment, labor force participation, and commodity prices also display some degree of seasonality and cyclicality.
In its most general form, the sine wave can be described using the function y=a*sin(bx), where:
Most financial/economic data can be modeled by varying the two components above. The amplitude dictates the magnitude of the swings, whereas the periodicity dictates how often the swings happen.
Increasing the amplitude makes the swings more violent and increases both the maximum height and depth of the wave. A negative amplitude creates a mirror image of the wave along the horizontal axis. They can be seen in the graphs below:


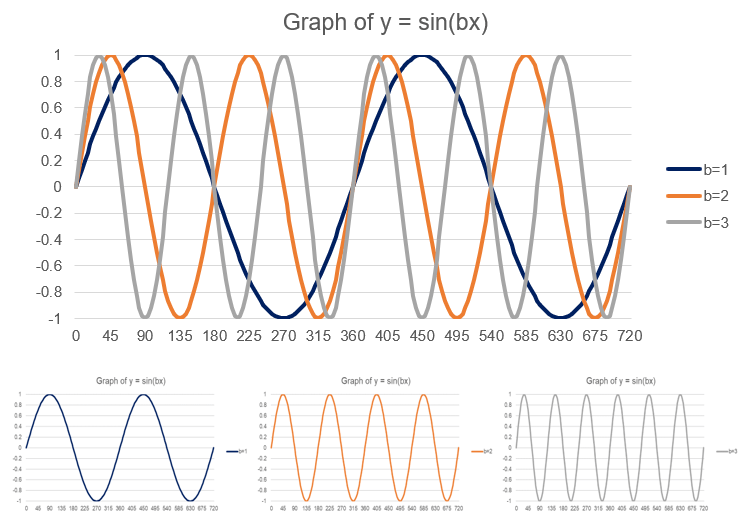
Increasing the periodicity makes the swings more frequent, which can be seen in the graph below:
To keep learning and developing your knowledge base, please explore the additional relevant resources below:


