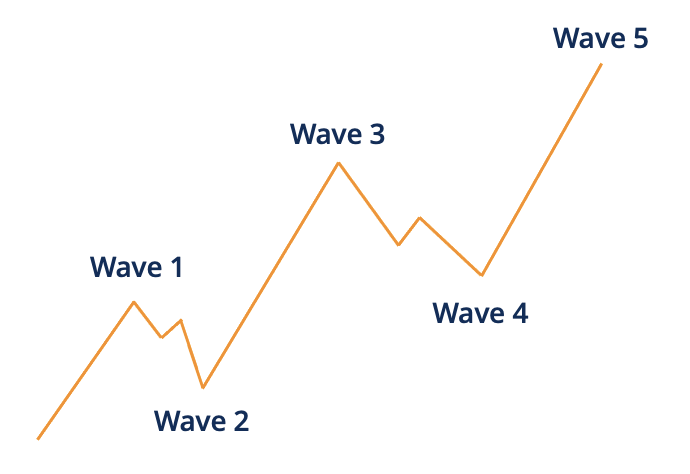
Impulse Wave Pattern

A technical trading concept that denotes a vigorous movement in a financial instrument’s price

Over 2 million + professionals use CFI to learn accounting, financial analysis, modeling and more. Unlock the essentials of corporate finance with our free resources and get an exclusive sneak peek at the first module of each course. Start Free

What is an Impulse Wave Pattern?

An impulse wave pattern refers to a technical trading concept that denotes a vigorous movement in a financial instrument’s price, interfering with the primary path of the usual trend. It is also used to discuss the Theory of Elliott Wave – a method used to evaluate and predict fluctuations in stock market prices.

Understanding Impulse Wave Patterns

One of the fascinating facts about the variations of impulse waves associated with the Elliott Wave Theory is that they are not limited to a fixed span of time. This allows certain waves to last for several hours, years, or decades. Regardless of the time frame used, the impulse waves run in a direction close to the pattern.

The impulse waves consist of five separate sub-waves that make net motions in the same direction as the trend of the next largest degree. This phenomenon is known to be a motive wave and can be quickly detected on the market. Identical to all the waves of motives, it comes with five distinct sub-waves: two corrective waves and three motive waves.

In addition, three distinct rules help to describe the formation. They are essentially unbreakable laws. If all of these laws are broken, the structure would not be called an impulse wave and must be re-labeled.

Summary

  • Impulse wave patterns are used to evaluate and predict fluctuations in the price of the stock market.
  • The impulse waves consist of five separate sub-waves that make net motions in a similar direction as the trend of the next largest degree.
  • The Elliott Wave Theory was developed to provide insight into the potential future course of major price changes in the stock market.

Understanding the Elliott Wave Theory

Ralph Nelson Elliott, a professional accountant, developed the hypothesis in the 1930s to provide insight into the potential future course of major price changes in the stock market. Later, his idea was accepted by the investor community.

In addition, the Eliott Wave Theory can be used together with further technical research to classify new opportunities. The principle works to assess the course of consumer values by the study of impulse waves and corrective wave patterns. Impulse waves comprise a total of five distinct smaller degree waves traveling in the form of a greater pattern, and corrective waves are the ones made up of three distinct smaller degree waves moving in the opposite direction.

Elliott indicated that wave retracements frequently agree with Fibonacci ratios, such as 38.2% and 61.8%, based on the 1.618 golden ratio. Wave patterns are components of the Elliott Wave oscillator and an Elliott Wave-inspired instrument that represents price trends as either positive/ negative or above/below a set horizontal axis.

The Elliott Wave Theory remains a popular trading technique due to the success of Robert Prechter and his associates at Elliott Wave International, a market analysis company founded to apply and improve Elliott’s original work by combining it with new technology such as artificial intelligence.

Rules for the Identification of Impulse Waves

The following are the three laws for impulse waves:

1. Wave 2 cannot trace more than 100% of Wave 1

Impulse Wave Pattern - Rule 1

Often, wave 2 traces from 38%-78% of the distance traveled by wave 1. The Fibonacci method in the charting kit is used to measure the ranges. The typical stop point for wave 2 is close to the 61.8% mark. It is likely that the retracement of wave 2 is greater than 78% (though rare), and wave 2 will also never trace 100% or above of wave 1.

2. Wave 3 will never be the smallest of Waves 1, 3, and 5

However, several times, wave 3 is the longest. Though wave 3 does not necessarily need to be the longest, it can never be the smallest.

3. Wave 4 cannot coincide with Wave 1

Although the impulse prints in the direction of the near-term pattern, the remedial waves (waves 2 and 4) do not interfere with each other. Essentially, the trend is so high that counter-trend efforts to minimize the trend are superficial and do not converge.

Additional Resources

CFI offers the Capital Markets & Securities Analyst (CMSA)® certification program for those looking to take their careers to the next level. To keep learning and advance your career, the following resources will be helpful:

0 search results for ‘