Get Certified for Financial Modeling (FMVA)®
Gain in-demand industry knowledge and hands-on practice that will help you stand out from the competition and become a world-class financial analyst.
A business planning tool used to evaluate the strategic position of a firm's’ brand portfolio
The Boston Consulting Group Matrix (BCG Matrix), also referred to as the product portfolio matrix, is a business planning tool used to evaluate the strategic position of a firm’s brand portfolio.
The BCG Matrix is one of the most popular portfolio analysis methods. It classifies a firm’s products and/or services into a two-by-two matrix. Each quadrant is classified as low or high performance based on relative market share and market growth rate. Learn more about strategy in CFI’s Business Strategy Course.
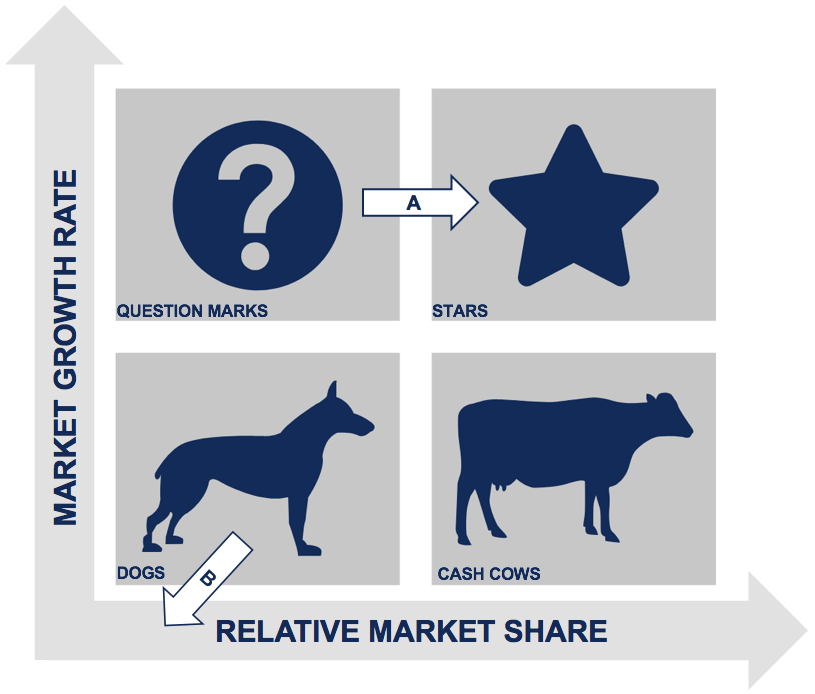
The horizontal axis of the BCG Matrix represents the amount of market share of a product and its strength in the particular market. By using relative market share, it helps measure a company’s competitiveness.
The vertical axis of the BCG Matrix represents the growth rate of a product and its potential to grow in a particular market.
In addition, there are four quadrants in the BCG Matrix:
The assumption in the matrix is that an increase in relative market share will result in increased cash flow. A firm benefits from utilizing economies of scale and gains a cost advantage relative to competitors. The market growth rate varies from industry to industry but usually shows a cut-off point of 10% – growth rates higher than 10% are considered high, while growth rates lower than 10% are considered low.
Learn more about strategy in CFI’s Business Strategy Course.
Products in the question marks quadrant are in a market that is growing quickly but where the product(s) have a low market share. Question marks are the most managerially intensive products and require extensive investment and resources to increase their market share. Investments in question marks are typically funded by cash flows from the cash cow quadrant.
In the best-case scenario, a firm would ideally want to turn question marks into stars (as indicated by A). If question marks do not succeed in becoming a market leader, they end up becoming dogs when market growth declines.
Products in the dogs quadrant are in a market that is growing slowly and where the product(s) have a low market share. Products in the dogs quadrant are typically able to sustain themselves and provide cash flows, but the products will never reach the stars quadrant. Firms typically phase out products in the dogs quadrant (as indicated by B) unless the products are complementary to existing products or are used for a competitive purpose.
Products in the star quadrant are in a market that is growing quickly and one where the product(s) have a high market share. Products in the stars quadrant are market-leading products and require significant investment to retain their market position, boost growth, and maintain a competitive advantage.
Stars consume a significant amount of cash but also generate large cash flows. As the market matures and the products remain successful, stars will migrate to become cash cows. Stars are a company’s prized possession and are top-of-mind in a firm’s product portfolio.
Products in the cash cows quadrant are in a market that is growing slowly and where the product(s) have a high market share. Products in the cash cows quadrant are thought of as products that are leaders in the marketplace. The products already have a significant amount of investments in them and do not require significant further investments to maintain their position.
Cash flows generated by cash cows are high and are generally used to finance stars and question marks. Products in the cash cows quadrant are “milked” and firms invest as little cash as possible while reaping the profits generated from the products.
Connect what you just learned to a clear career path with CFI’s role‑based courses and certification programs.


