
Get In-Demand Finance Certifications
A decision-making tool used to compare and fix problems strategically
Pareto analysis is a decision-making tool used to compare and fix problems strategically. It uses the Pareto principle, which is also known as the 80/20 rule – named after Italian economist Vilfredo Pareto. He found that many phenomena or trends follow the 80/20 rule.

For example, in Pareto’s first works, he found that 80% of income in Italy went to 20% of the population. The Pareto principle can be seen all around the world in many different settings, within businesses, and beyond.
For example:
The 80/20 rule can be used to strategically select the problems in a company to fix that will result in the most impact. It can help stimulate creative thought and organized thinking around business innovation or problem-solving. One important note is that the 80/20 rule is purely a convenient rule of thumb, not an exact ratio or law.
Ideally, the list is gathered through feedback from employees, clients, or customers. Common examples include anonymous complaint/feedback forms, customer surveys, or employee organizational recommendations.
Why did the problem occur? Make sure to think about the root cause, which might be hidden under the surface.
Assign a number to each problem based on the negative impact associated with it. The scoring system will depend on the type of problem trying to be solved. For example, for a cellular company, did a customer complaint make them leave the carrier, change their plan (negatively), or not change anything?
Group all of the similar problems together and calculate the collective scores. The problem with the highest score will most likely be the one you should try to resolve first and provide the highest return. Recommended to create a Pareto graph, as seen below, to help visualize the data.
The following example comes from a cellular telephone service provider. The data is collected from customer review forms that were submitted following their choice to leave the cellular carrier. The company decides to perform a Pareto analysis on the data to try and figure out what they should focus on first to improve their offering.
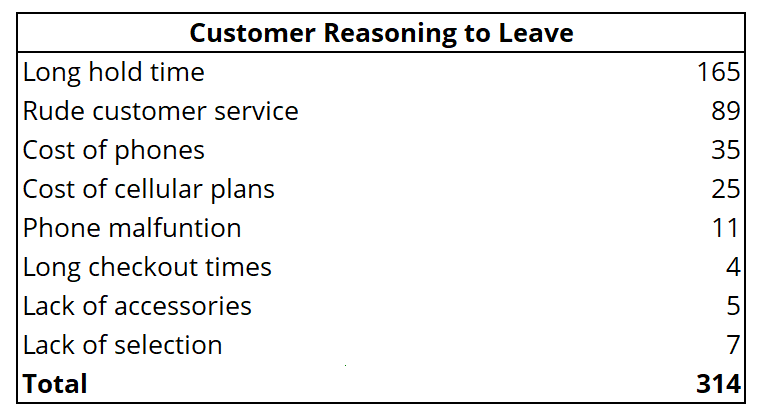
As you can see, the majority of complaints (about 80%) stem from either long hold times or rude customer service. The 80% can be seen in the graph below highlighted by the dotted line.
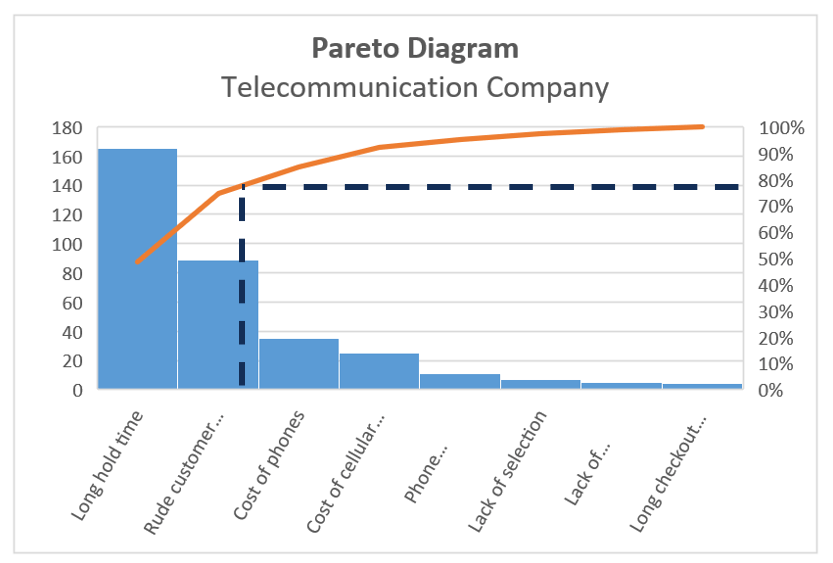
From a business strategy perspective, those two problems should be addressed first to achieve maximum impact. Judging by the comments, we can assume that hiring more staff and/or training them better would be the best course of action.
Pareto analysis offers several benefits, depending on what specific type of project it is being used for. It helps identify problems and prioritize task completion.
Pareto analysis can help improve efficiency, profitability, and much more. Ultimately, it optimizes the overall organization’s performance by coordinating the highest return activities to pursue.
Like all business analysis techniques, Pareto analysis comes with limitations. The most prevalent is the ease of overlooking small complications during the analysis, which can add up over time. Also, it does not factor in the severity of a defect or problem, only the quantity.
It is essential to use other types of research to make the most educated decision in problem-solving. Alternative types of problem-solving analytical tools that can be used in parallel to Pareto analysis include hazard analysis, fault tree analysis, and functional failure mode and effect analysis.
Connect what you just learned to a clear career path with CFI’s role‑based courses and certification programs.
In order to help you become a world-class financial analyst and advance your career to your fullest potential, these additional resources will be very helpful:


