Deviation Risk Measure

A function used to measure financial risk

Over 1.8 million professionals use CFI to learn accounting, financial analysis, modeling and more. Start with a free account to explore 20+ always-free courses and hundreds of finance templates and cheat sheets.

What is Deviation Risk Measure?

Deviation risk measure is a function that is used to measure financial risk, and it differs from general risk measurements. Risk measurement is primarily used in the finance industry to measure the movement and volatility of an investment.

When investing in stocks, options, and other investments, traders are interested in knowing the probability of the price of the investment moving in a certain direction, resulting in a profit or a loss. To achieve their objectives, traders use various functions to determine the risk and volatility of a stock, with deviation risk measure being one of the most used functions.

Deviation Risk Measure

What is Standard Deviation?

Standard deviation is a mathematical concept that is employed in various disciplines such as finance, economics, accounting, and statistics. It measures how spread individual data points are from the mean value. Standard deviation is computed by deducting the mean from each value, calculating the square root, adding them up, and finding the average of the differences to obtain the variance. Variance measures how numbers in a data set are spread, and it is used as an indicator of volatility in a data set.

When evaluating mutual funds or securities to invest in, traders prefer using standard deviation as risk measurement due to its ability to show the volatility of a trade. Typically, traders calculate the annual rate of return of each portfolio to determine the probability of the portfolio producing consistent returns in the future.

For example, high-growth security will show a higher standard deviation since its return keeps on peaking and reversing before settling on a specific point. It means that the security is highly volatile and carries a higher degree of risk that a risk-averse investor will be uncomfortable with. On the contrary, old securities with a track record of providing consistent returns will produce a low variance, which shows that the security carries a low amount of risk.

How Deviation Measures Risk?

When using standard deviation to measure risk, analysts are interested in knowing how the annual interest rate is spread out, which dictates how risky the investment is. Securities with a wider range and an unpredictable movement carry more risk and will come with a lot of uncertainties as to the direction of the price.

For example, a growth-oriented stock will experience a lot of spikes and reversals, and its direction will be uncertain. A risk-seeking investor prefers such unpredictable stocks since they offer a greater profit potential when the timing is right. Pretty constant stocks come with low risk since they are likely to stay within the same range for a long time. An example is a stock that returns 7%-10% during a full trading year.

Risk Measure in the Stock Market

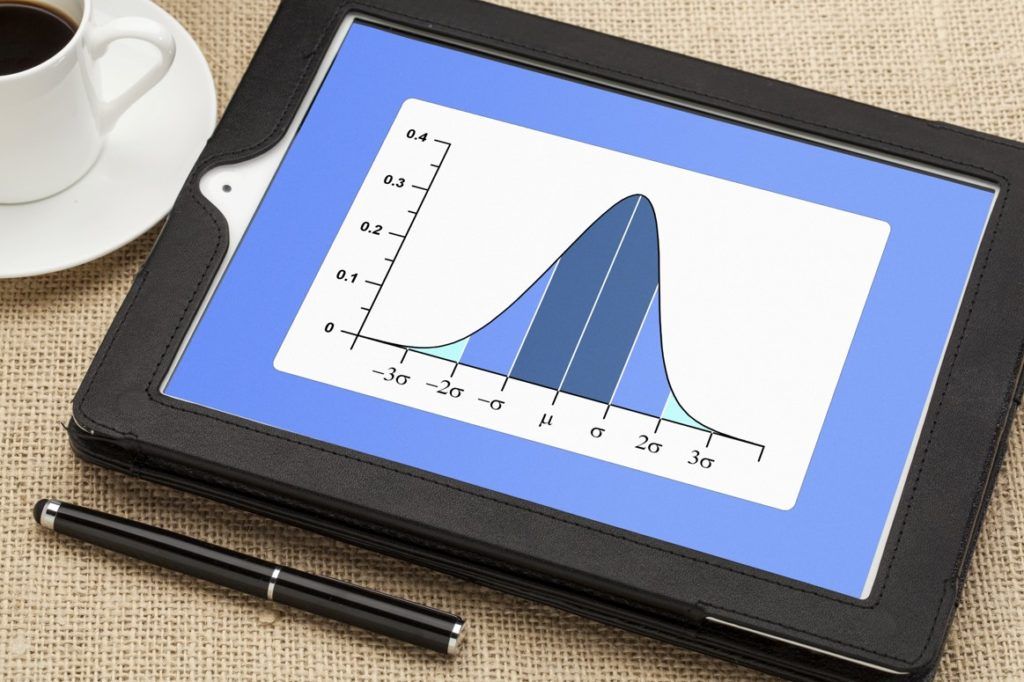
When trading securities in the stock market, traders rely on the assumption that securities follow a normal distribution. A normal distribution forms a bell shape, with one highest point on the curve, and two downward sloping lines on either side of the curve. The highest point represents the most probable outcome while the other lines show other possible outcomes.

When analyzing potential securities to invest in, the expectation is that the values will fall one deviation away from the mean 68% of the time, while 95% of the time, the values will fall two deviations away from the mean. Investors and stock analysts use the normal distribution of a stock’s historical performance to calculate the expected future returns.

Consistency of Standard Deviation

The consistency of standard deviation makes it popular as a risk measurement function. For example, when you say the values fall two standard deviations from the mean 95% of the time, such a consistency remains the same whether you are talking about age, weight, or crop yields. It means that investors can make predictions with certainty that the characteristics being measured will not exceed the range created.

Limitations of Using Standard Deviation as a Risk Measurement Metric

Standard deviation as a risk measurement metric only shows how the annual returns of an investment are spread out, and it does not necessarily mean that the outcomes will be consistent in the future. The investments may be affected by other non-related factors such as interest rate changes and market competition, and the annual return may fall outside the predicted range. It means that standard deviation should not be used as the final risk measurement tool, but should be used alongside other risk measurement functions.

Another weakness of deviation risk measurement is that it assumes a normal distribution of data values. It means that there is a uniform probability for achieving values above or below the mean. For example, 68% of the time, all individual values will fall one standard deviation away from the mean. The assumption may not apply to all types of investments such as hedge funds, which tend to be skewed towards one direction.

Additional Resources

CFI is the official provider of the Financial Modeling and Valuation Analyst (FMVA)™ certification program, designed to transform anyone into a world-class financial analyst.

To keep learning and developing your knowledge of financial analysis, we highly recommend the additional resources below:

0 search results for ‘