Double Exponential Moving Average (DEMA)

An indication of the price movement of an asset or security over a certain number of past periods

Over 1.8 million professionals use CFI to learn accounting, financial analysis, modeling and more. Start with a free account to explore 20+ always-free courses and hundreds of finance templates and cheat sheets.

What is the Double Exponential Moving Average (DEMA)?

Double exponential moving averages (DEMA) are an improvement over Exponential Moving Average (EMA) because they allocate more weight to recent data points. The reduced lag results in a more responsive moving average, which helps short-term traders spot trend reversals quickly.

Double Exponential Moving Average (DEMA)
Source: Trading View

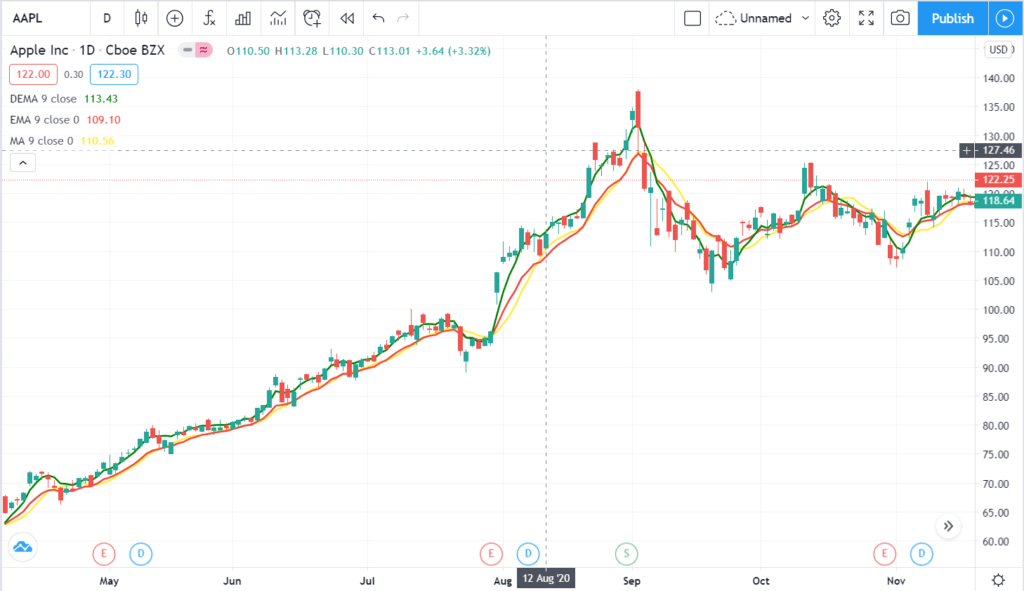
Let us look at Apple Inc.’s prices over a period of nine months from April to November 2020. The chart uses candlesticks, which are used to reflect the change in Apple’s stock price for each period.

The yellow line is the simple moving average line. The red line indicates exponential moving average (EMA), and the green one is the DEMA line. We can observe that the DEMA is closest to the price points and with the least deviations.

Since the DEMA line mimics the stock prices most closely, it is, therefore, most sensitive to the stock volatility. Changes in volatility are good indicators for a trend reversal, and hence, stock trades. Let us look at differences when the number of days for the DEMA is changed:

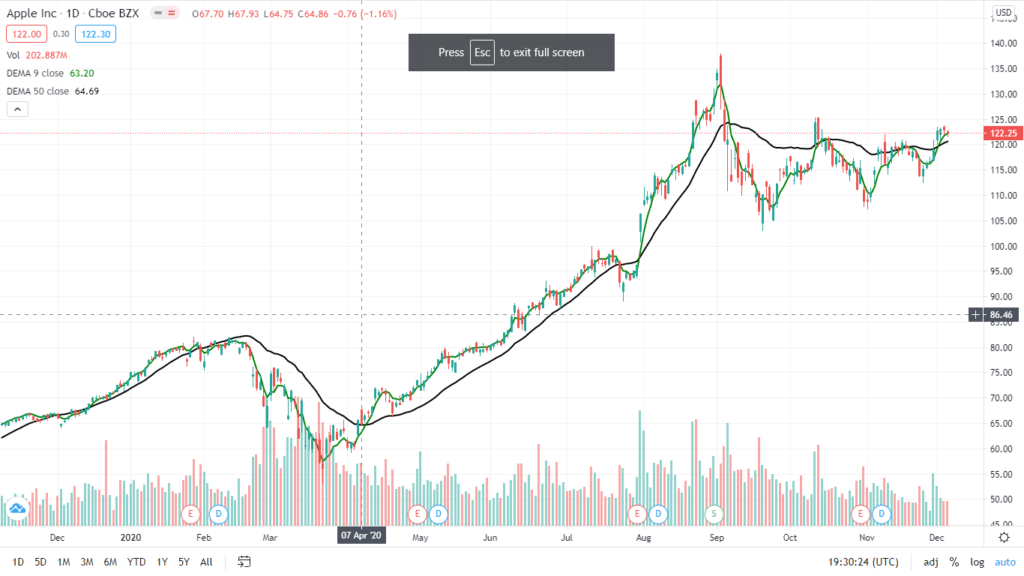
50 Days DEMA
Source: Trading View

The black line is the 50 days DEMA, which is significantly detached from the stock prices compared to the nine days DEMA, which is the green line. The moving averages are dependent on the last data point, and the lower the number of days of moving averages, the higher the effect of the last data point will be.

It can be seen here that the lesser the number of days used to calculate the moving average, the higher the volatility will be of that moving average. Hence, DEMA of a lower number of days will be more volatile and will incorporate the price changes more accurately.

Calculating the Double Exponential Moving Average (DEMA)

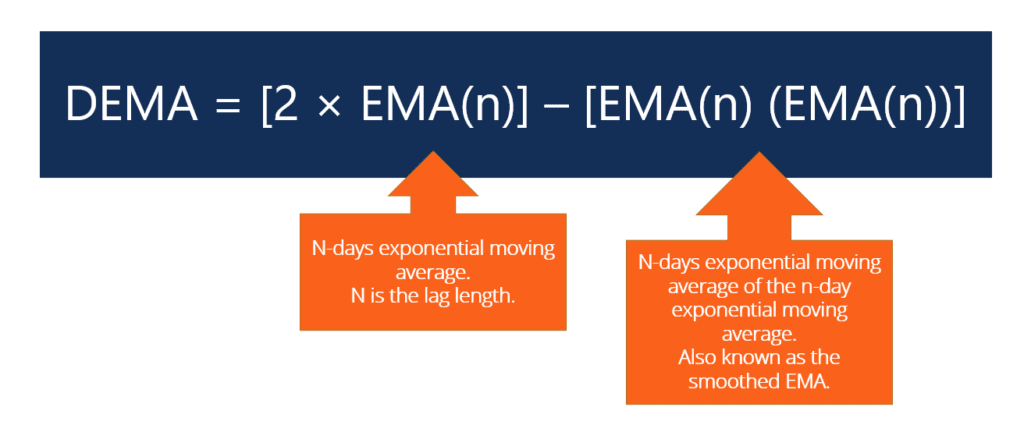
The Double Exponential Moving Average (DEMA) is a combination of smoothed exponential moving averages (EMA) and a basic EMA. The combination reduces the lag in the combined DEMA. DEMA can be represented as:

Double Exponential Moving Average - Formula

DEMA is named so because it uses an EMA of the EMA and not because it uses 2*EMA. Similarly, there is another popular measure known as triple EMA, which uses the EMA of the EMA of the EMA.

Applications of the Double Exponential Moving Averages

The DEMA is used similarly to simple or exponential moving averages. They can be used in:

1. Trend Analysis

Trend analysis refers to the use of the movement of historical asset prices to predict future movement. DEMA is an important trend indicator for technical analysis. The direction of the DEMA is the direction in which the asset prices are expected to move in the future. Rising DEMA signifies a probable rising price, whereas falling DEMA signifies a probable asset price fall.

A price point of an asset above the DEMA is likely to rise, and the price point below is likely to fall. If the asset price line moves above the DEMA, this indicates that the falling trend in prices will reverse. Similarly, if the asset price line moves below the DEMA, the price rise is expected to reverse the trend, and prices fall. Traders use the cues to go long or short to earn profits using directional trading strategies.

2. Support and Resistance

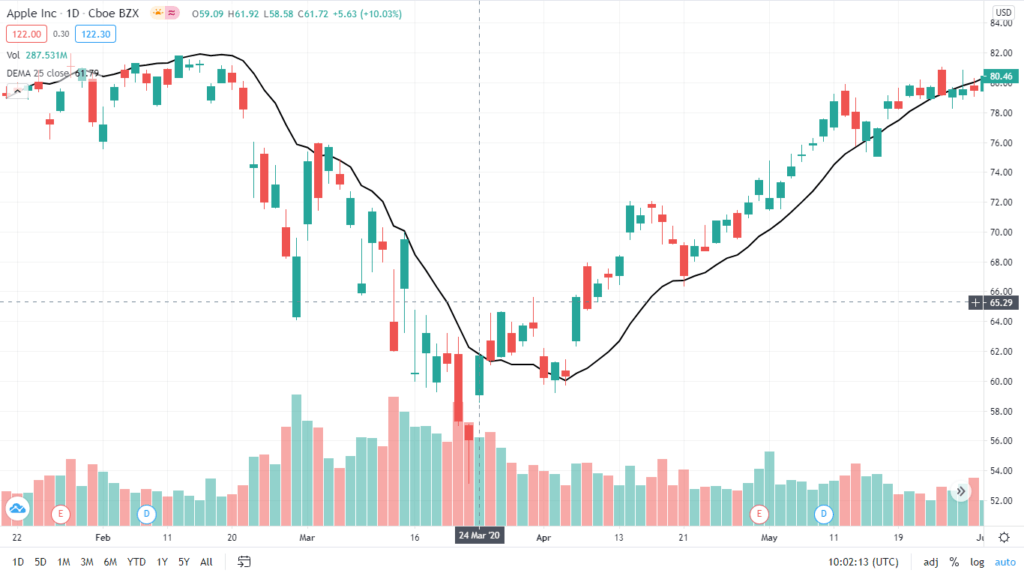
Another important use of exponential averages, including DEMA, is to show support and resistance levels for the stock prices. Resistance levels indicate where the stock prices show little inertia to go higher, whereas support levels indicate where prices are not likely to fall below.

DEMA - Support and Resistance
Source: Trading View

The graph shows a 25-days DEMA line for AAPL stock over a period of approximately four months. The first half shows the candlesticks below the black-colored DEMA line, which acts as the resistance. Once the stock price moves above the line around March 24th, the price does not fall below the DEMA line. The line now acts as the support.

The change of support and resistance where stock prices move above the resistance line is known as a breakout. Breakout is an important trend reversal indicator and is regularly used by the traders.

Difference Between Different Moving Averages

The simple moving average is the simple average of the past n-day asset prices. The exponential moving average provides more weight on the more recent observation. The DEMA provides an even greater weight on the most recent observations.

To sum up, moving averages are used as a technical indicator. The greater the weight on the most recent observation, the greater the moving average is susceptible to the price changes. DEMA is therefore preferred by short-term traders, whereas simple moving averages are preferred by long-term investors.

Additional Resources

CFI offers the Capital Markets & Securities Analyst (CMSA)™ certification program for those looking to take their careers to the next level. To keep learning and developing your knowledge base, please explore the additional relevant resources below:

0 search results for ‘