Get Certified for
Capital Markets (CMSA®)
From equities and fixed income to derivatives, the CMSA certification bridges the gap from where you are now to where you want to be — a world-class capital markets analyst.
A technical analysis method used to describe the movement of securities, currencies, and derivatives
Japanese Candlesticks are a technical analysis tool that traders use to chart and analyze the price movement of securities. The concept of candlestick charting was developed by Munehisa Homma, a Japanese rice trader. During routine trading, Homma discovered that the rice market was influenced by the emotions of traders, while still acknowledging the effect of demand and supply on the price of rice.
Homma developed candlesticks that graphically displayed the nature of price movements by using different colors to denote the differences. Traders can use the candlesticks to identify patterns of price action and make decisions based on the short-term direction of the prices.
As a legendary rice trader of financial instruments, Homma dominated the rice markets and became popular for discovering the candlestick charting method. When the Japanese stock market began in the 1870s, local technical analysts incorporated Homma’s candlestick methodology into the trading process. American technical analyst Steve Nison introduced the technique to the West through his book “Japanese Candlestick Charting Technique.” Japanese Candlestick charting is now a popular technical indicator that traders use to analyze financial markets.
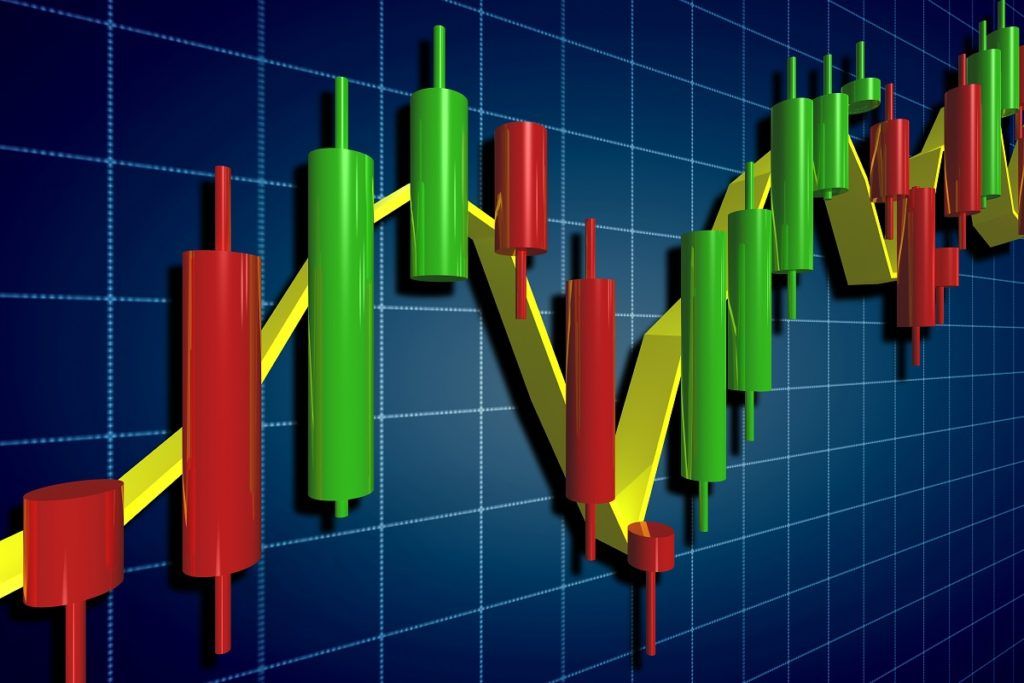
Japanese Candlesticks provide more detailed and accurate information about price movements, as compared to bar charts. They provide a graphical representation of the supply and demand behind each time period’s price action.
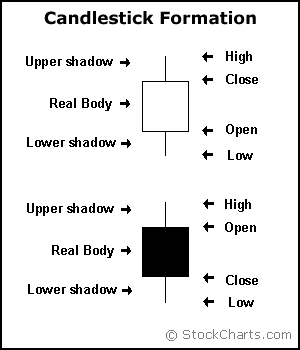
Each candlestick includes a central portion that shows the distance between the open and the close of the security being traded, the area referred to as the body. The upper shadow is the price distance between the top of the body and the high for the trading period. The lower shadow is the price distance between the bottom of the body and the low for the trading period
The closing price of the security being traded determines whether the candlestick is bullish or bearish. The real body is usually white if the candlestick closes at a higher price than it opened. In such a case, the closing price is located at the top of the real body and the opening price is located at the bottom.
If the security being traded closed at a lower price than it opened for the time period, the body is usually filled up or black in color. The closing price is located at the bottom of the body and the opening price is located at the top. Modern candlesticks now replace the white and black colors of the body with more colors, such as red, green, and blue. Traders can choose among the colors when using electronic trading platforms.
Both Japanese candlesticks and bar charts provide the same information to traders but in different graphical formats. Candlesticks are more visual, presenting traders a more graphically clear picture of price action. They also display graphically the forces (supply and demand) that contribute to each time period’s price movement.
On a candlestick chart, the area above and below the body is known as shadows. The length of the candlestick body and the shadows are both important indicators of price action.
Japanese Candlesticks form patterns that traders use to analyze price movement. Some examples of candlestick patterns include:
Doji: This is a candlestick formed when the opening and closing prices are the same, or very close to each other. The shadows may have different lengths.

Gravestone Doji: This pattern resembles a gravestone, hence the name. It is formed when the open and the close occur at the low of the period.

Dragonfly Doji: This pattern is formed when the opening and the closing prices of a security are at the high of the period. It includes a long lower shadow and signals a reversal of an uptrend.

Bearish Engulfing Pattern: This pattern indicates bears in control of the market. It consists of a large body that completely engulfs the body of the previous candlestick. It is a “down” candlestick, one where the closing price is below the opening price. When it appears, it signals a bearish reversal.

Bullish Engulfing Pattern: The pattern is often formed at the end of a downtrend. It is comprised of a smaller down candlestick whose body is engulfed by a larger up candlestick.

Hammer: The Hammer pattern includes a long tail on its lower end and a near-negligible upper shadow. It is typically a signal of a market reversal, either bullish or bearish.

Thank you for reading CFI’s guide on Japanese Candlestick. To keep learning and developing your knowledge of financial analysis, we highly recommend the additional resources below:


