Get Certified for
Capital Markets (CMSA®)
From equities and fixed income to derivatives, the CMSA certification bridges the gap from where you are now to where you want to be — a world-class capital markets analyst.
A technical indicator of momentum that utilizes the positive or negative flow of the volume of trading
On-Balance Volume Indicator (OBV) refers to a technical indicator of momentum that utilizes the positive or negative flow of the volume of trading to reflect the relative buying and selling pressure on a financial asset, with the aim of predicting the probable direction of near-term price changes. In other words, OBV tracks increasing or decreasing volume to project future price movements.

OBV was created by Joseph Granville in the early 1960s and elucidated in his book, “Granville’s New Key to Stock Market Profits.” Granville argued that volume is a key determinant and, therefore, a reliable predictor of stock price movements.
While he only applied his new volume indicator to the analysis of stocks, it has since been used by traders in other financial trading markets, such as commodity futures and forex trading.
You use one of three possible calculations to get the current on-balance volume, the choice of which depends on the closing price of the traded financial asset (such as stock).
(Because OBV is a cumulative indicator – the running total of positive volume and negative volume – the calculation begins with a selected starting value of the OBV at a previous point in time – i.e., the OBV at the close of the previous trading day).
If the closing price of the asset is higher than the previous day’s closing price:
If the closing price of the asset is the same as the previous day’s closing price:
If the closing price of the asset is lower than the previous day’s closing price:
By adding volume to the running OBV total on days when a security’s price goes up and subtracting the day’s volume on down days in price, the trend of on-balance volume – whether the total is rising or declining – should typically mirror the current price trend.
However, when the OBV indicator makes a significant move without an accompanying move in price or in the opposite direction of price, traders begin to anticipate a possible trend change in price to emerge soon.
It is not necessary to manually calculate the on-balance volume day to day. You can simply load the on-balance volume indicator onto a stock chart. The absolute numerical values of the OBV at any given point in time are not considered as important as the OBV’s general directional movement, which is easily indicated with a chart line.
According to Granville, changes in volume – both in the amount of volume and in the trend of volume (that is, whether the daily trading volume is generally increasing or decreasing) – are often a leading indicator of changes in a stock’s price.
In other words, traders monitoring the on-balance volume in stock can expect to see a trend of increasing volume often arise before an uptrend in the stock price begins. Conversely, a falling volume trend is interpreted as a signal that the stock price itself is likely to enter a corresponding downtrend soon.
Granville also theorized that if volume begins to markedly increase or decrease while the stock price remains relatively flat, the pressure of greater amounts of buying or selling was likely to eventually result in a very sharp price move to the upside or downside – rather like blowing the lid off a pot of boiling water.
Many traders simply use the on-balance volume indicator as a confirming technical indicator of a stock’s price trend. For example, when a stock is steadily rising in price, traders monitoring the on-balance volume indicator will expect to see it rising as well.
As with other momentum indicators, such as the MACD, higher levels of the OBV indicator’s stronger momentum reinforces the current price trend. When the OBV diverges from the direction of a security’s price movement, it may be an early indicator of a pending trend change.
For example, if a stock’s price continues to rise, but the on-balance volume indicator begins to decline, that may be interpreted that the previous buying momentum in the stock is beginning to wane. The stock price may soon peak and turn to the downside.
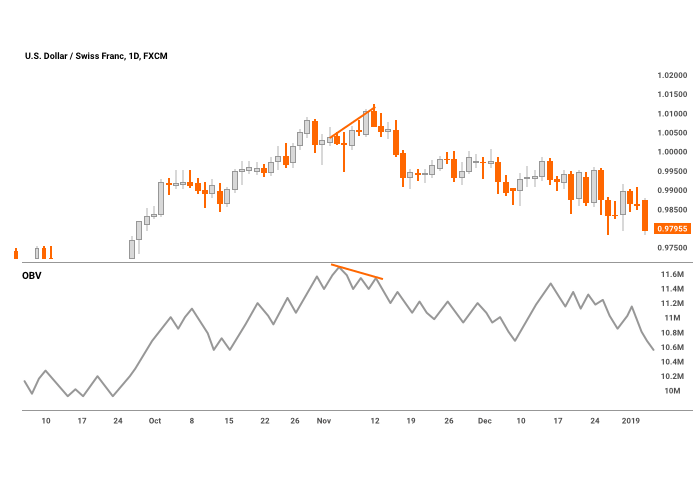
The chart below shows an instance of divergence with the on-balance volume indicator. Marked with orange lines in about the middle of the chart, you can see where price continues to rise to a new high while the OBV indicator (shown in the lower chart window) turns to the downside with a decline in volume.
The divergence correctly presaged a price turn from an uptrend to a downtrend that followed about a week after the on-balance volume trend turned downward. From that point forward, the continued decline in OBV confirmed the ongoing downtrend in price.
CFI offers the Capital Markets & Securities Analyst (CMSA)® certification program for those looking to take their careers to the next level. To keep learning and advancing your career, the following resources will be helpful:


