Get Certified for
Capital Markets (CMSA®)
From equities and fixed income to derivatives, the CMSA certification bridges the gap from where you are now to where you want to be — a world-class capital markets analyst.
A visual representation that gives the yield to maturity for various types of bonds
The par yield curve is a graphical representation that shows the yield to maturity (YTM) for various types of bonds. Often, it is used to examine if treasury bonds are a strong investment in current market bond conditions. It gives the single discount rate that would be used to discount the entirety of the bonds’ cash flow in the open market at the present price.

Line charts are typically used to visually show the researcher the relationship between different bond yields and market interest rates. A par yield curve occurs when the yield to maturity of the security being purchased is at par with treasury bond interest rates.
The graph shows the yield to maturity of coupon bonds at their different maturity dates. It is the total return that an investor expects to make if they hold the instrument until its maturity. As the interest rate fluctuates over time, the yield to maturity increases or decreases to reflect the current rate environment.
If interest rates decrease after bond issuance, the value of the bond will see a consequent increase. It is because the coupon rate on the bond is now higher than the current rate in the market.
Thus, the interest rate will consequently be higher than the yield to maturity and will be visually represented in the visualized yield curve. “Par yield” occurs when bond and interest rates are trading at par, meaning that the bond interest rates and interest rates in the open market are identical to one another.
The pay yield curve is only used in the primary market when new bond rates are issued. The logic behind such reasoning is that the issuer would not want to issue bonds that are made unattractive due to interest rates. Visually, a par yield curve can look like many other yield curves, depicted below:
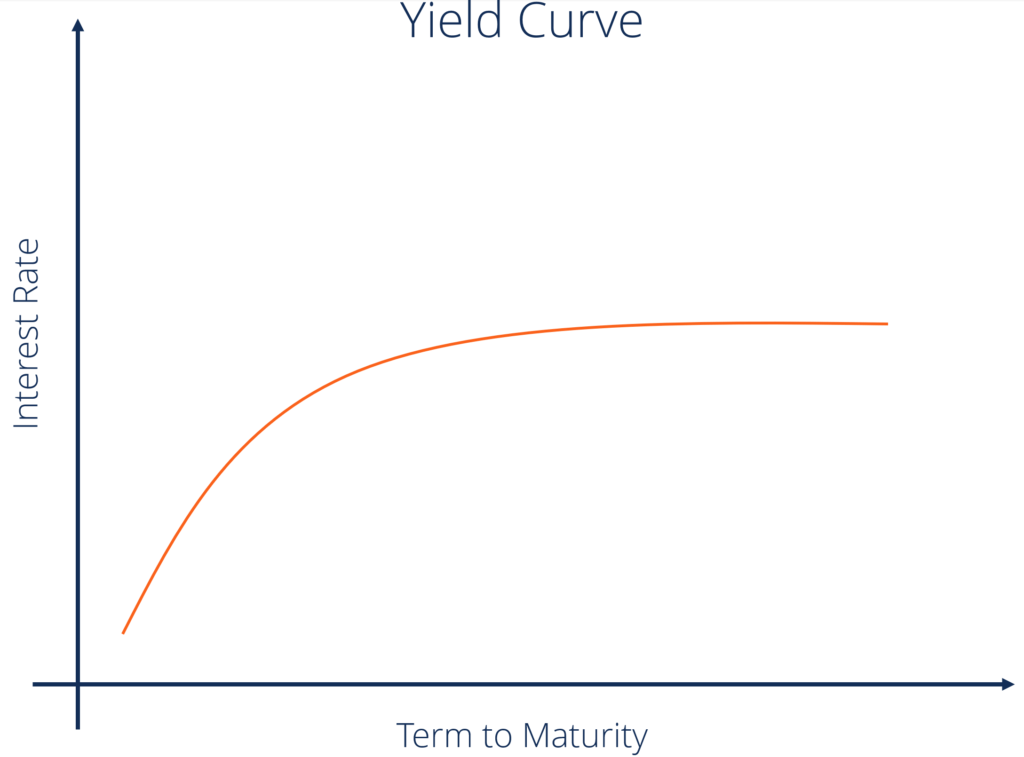
However, it is important to note that a par yield curve will be identical to market interest rates at the time, even though graphically, it may look similar to a standard yield curve.
Short-term bonds generally come with lower yields, so the curve slopes up and to the right (similar to the image above). It also occurs in the par yield curve. Generally, the par yield curve falls below the spot and forward yield curve in normal market situations.
As an investor, bonds are an integral part of any portfolio you build and can serve as one of the cornerstones of your investment strategy. However, there is a risk when purchasing a bond with a long yield.
Money placed in the bond carries with it an opportunity cost; funds can be invested in other instruments, even those that carry a guarantee on principle. As such, understanding what the par yield curve represents and how it can affect the time value of your money is critical when using Treasury bonds and the like as part of your investment portfolio and strategy.
CFI offers the Capital Markets & Securities Analyst (CMSA)® certification program for those looking to take their careers to the next level. To keep learning and advance your career, the following resources will be helpful:


