Get Certified for
Capital Markets (CMSA®)
From equities and fixed income to derivatives, the CMSA certification bridges the gap from where you are now to where you want to be — a world-class capital markets analyst.
A tool to help determine the price trend of a specific stock
A Resistance line, sometimes also known as a Speed Line, helps identify stock trends and levels of support and resistance. Resistance lines are technical indication tools used by equity analysts and investors to determine the price trend of a specific stock. They are very useful in predicting the probable movement of stock prices and helping people invest in the right stock.
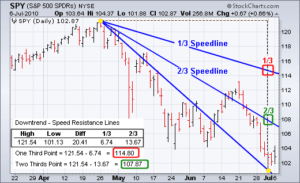
Resistance lines are usually drawn on a high-to-low basis. They help estimate resistance and support levels, making them a very useful tool in trading. A resistance line in an uptrend movement marks the support area and a resistance line in a downtrend movement marks the resistance area. The three lines in the graph below indicate a downtrend movement and proper analysis of them will help lead to a sound investment decision.
The concept of the stock market is simple – risk and return are two parallel factors that move together. Generally speaking, the more the risk you take, the greater the return you can expect. However, there are other things that you should factor in before arriving at any investment decision.
There are two types of analysis that can help you arrive at a sound investment decision. The first is fundamental analysis and the second is technical analysis. A resistance line is one of the tools used in technical analysis to predict future prices and guide investment decisions. The line is an effective tool to calculate the movement of a stock and is often used in a stock chart to make predictions.
We refer again to the chart above to understand how a resistance line works. We can see there are three lines that indicate the downfall of the stock from its April high. The first line extends from the April high all the way to the July low. The second line shows 2/3 of the April high and July low, e.g., 121.54 – 6.74 = 114.08 (the calculations can be observed in the bottom-left corner of the chart shown above. The third line indicates 1/3 of the April high and July low, e.g., 121.54 – 13.67 = 107.87.
The three lines indicate the trend by showing how the stock is moving over time and how there are upward movements along with the overall prevailing downward movement. Resistance lines help analysts more clearly define a trend and probable price movement in the future, as the lines move toward the right and the system calculates based on the prices at different periods of time. Basically, resistance lines help investors or market analysts observe a pattern that identifies resistance and support areas.
The main purpose of the resistance line is to let analysts figure out the short-term trend of a stock, but it can also serve the same purpose for a longer time frame. Identifying support and resistance areas helps an analyst decide on target prices for both buying and selling.
Resistance lines can be plotted for either uptrends or downtrends. Note that in an uptrend it would be more accurate to refer to the “resistance line” as a “support line” since the lines indicate price support levels. Whatever the trend is, drawing resistance lines on a chart enables an analyst to plot a trend graph.
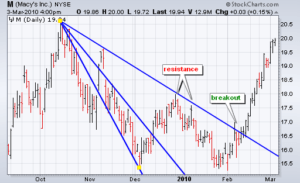
Let us use the chart above to show an example. The first line in the graph shows the start of a downtrend and extends until the end of December. It helps analysts see how long the downtrend remained for the stock and this can be compared with other trends such as industry trends or the trend of the overall market. The second line indicates the resistance points where an upward retracement meets resistance.
Calculating and drawing the additional 1/3 and 2/3 resistance lines helps analysts determine the pattern of resistance. When a breakout to the upside occurs, signaling a trend change, the third line, which previously marked resistance, then marks a support level for the newly-formed uptrend at the breakout price level.
Thank you for reading CFI’s guide on Resistance Line. To keep advancing your career, the additional CFI resources below will be useful:


