Get Certified for
Capital Markets (CMSA®)
From equities and fixed income to derivatives, the CMSA certification bridges the gap from where you are now to where you want to be — a world-class capital markets analyst.
A stock's average closing price over a specified period
Simple Moving Average (SMA) refers to a stock’s average closing price over a specified period. The reason the average is called “moving” is that the stock price constantly changes, so the moving average changes accordingly. SMA is one of the core indicators in technical analysis and is usually the easiest moving average to construct.

The aim of all moving averages is to establish the direction in which the price of a security is moving based on previous prices. Since SMA is constructed using past closing prices, it is a lag indicator. It means that it simply displays a previous trend, but it is not predictive of future prices.
SMA is often compared to EMA, which is the exponential moving average. The difference is that EMA places greater emphasis on recent prices, while SMA places equal weight on all data points. It usually results in the SMA line being much smoother.
Download our free Moving Averages Excel template, and start modeling today!
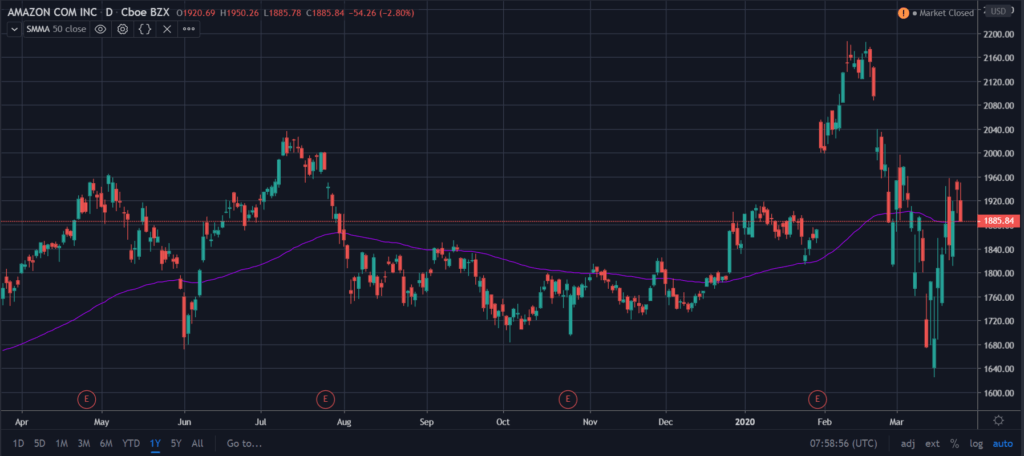
The chart above shows how the price of Amazon’s stock (NASDAQ: AMZN) changed over a 1-year period using a 50-day SMA. The 50-day SMA is represented using the purple line, which indicates the overall trend of how the price is moving. As described above, since SMA is an average of the prices over a specified time period, it does not react as drastically as the actual prices.
The concept can be observed during the February 2020 earnings announcements. Even though Amazon reported amazing earnings that hiked its stock price to open at around $2,000, the SMA still stayed relatively similar and only increased by a little bit.
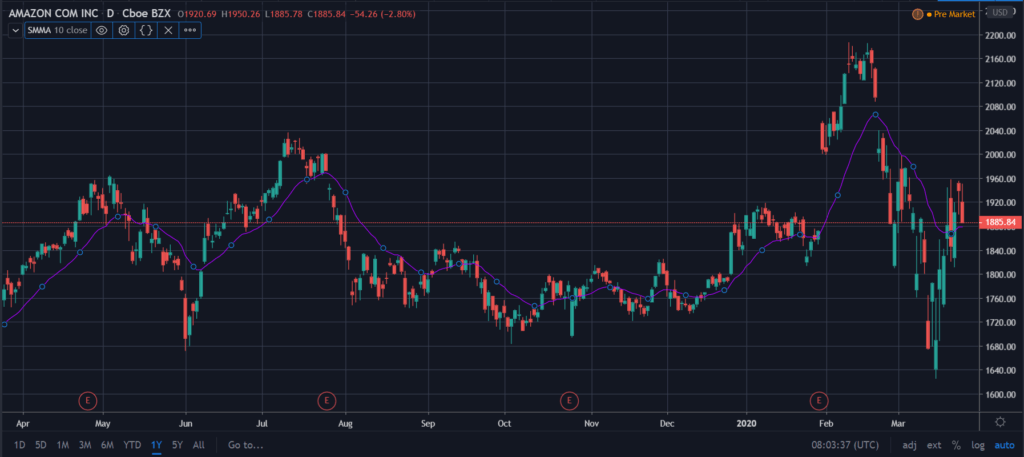
Above, a 10-day SMA was used. Since the SMA line was only calculated based on the previous 10 days’ stock price, the line follows price changes a lot more than the 50-day SMA shown in the previous chart.
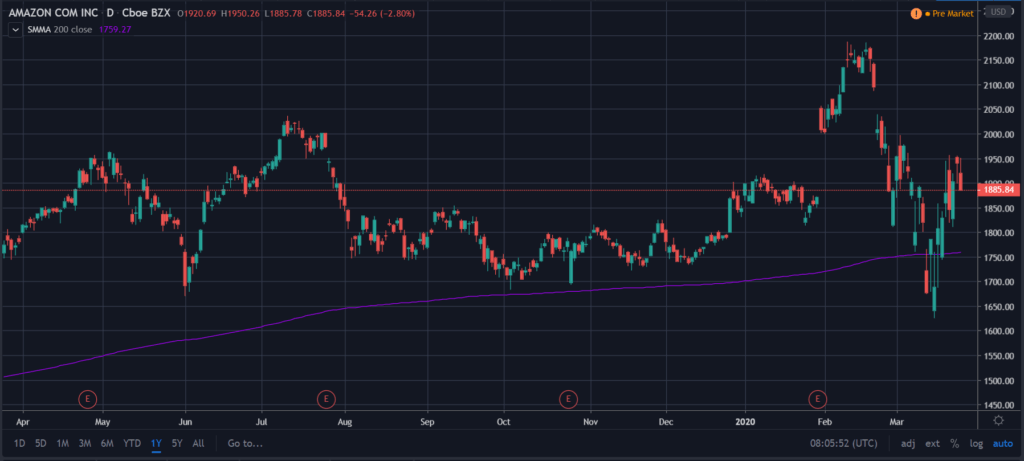
Above, a 200-day SMA was used. Since the line represents an average of the previous 200 days’ closing prices, the line is a lot smoother and is not easily influenced by price fluctuations.
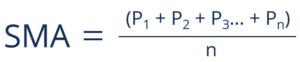
The equation for SMA is quite simple. It is just the average closing price of a security over the last “n” periods.
Let us give a quick and easy example. Suppose Company A posted the following closing stock prices:
| Day (n) | Prices (P) |
| 1 | $10 |
| 2 | $12 |
| 3 | $9 |
| 4 | $10 |
| 5 | $15 |
| 6 | $13 |
| 7 | $18 |
| 8 | $18 |
| 9 | $20 |
| 10 | $24 |
Using a 5-day SMA, we can calculate that at Day 10 (n=10), the 5-day SMA is $18.60.
SMA = (13 + 18 + 18 + 20 + 24) / 5 = 18.60
Using a 10-day SMA, we can calculate that at Day 10 (n=10), the 10-day SMA is $14.90.
SMA = (10 + 12 + 9 + 10 + 15 + 13 + 18 + 18 + 20 + 24) / 10 = 14.90
Compared with Day 10’s closing price of $24, the 5-day SMA of $18.60 was a lot closer than the 10-day SMA of $14.90. It is once again because the 5-day SMA is a shorter period, which follows the price more closely, whereas the 10-day SMA considers more historical data.
Technical traders often use SMAs to time their buy and sell trades. They perform their analysis by looking at when the stock price line intersects the SMA line. To understand it better, let us look at the Amazon example again with the 10-day SMA line.
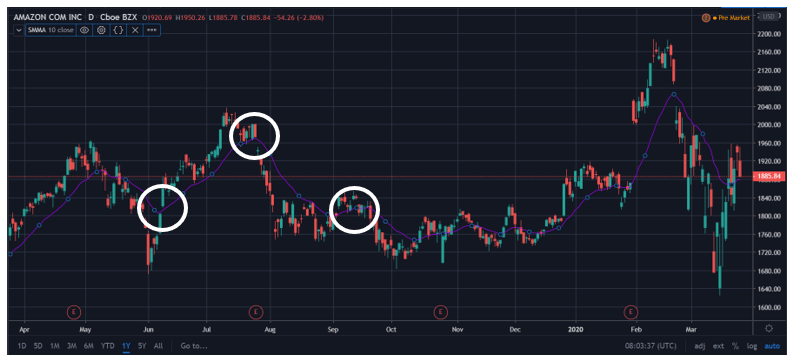
Looking at the graph above, we can see that when the price surpasses the SMA line, the prices often trend upward for some time. It is often used as a buy indicator for technical traders. However, when the price intersects and falls below the SMA line, we see a downtrend in prices for a bit as well. It may sometimes be a good indicator to sell.
However, investors must be careful when trying to time the intersections, as the SMA is based on historical information and lags behind real-time data.
SMA crossover strategy is another technical strategy used for entering and closing trades. The strategy is done by plotting two SMA lines based on two different time frames. Looking at when the lines cross over, it helps certain traders time their trades. The most popular moving averages for longer-term investors are the 50-day and 200-day SMAs. For shorter-term investors, the 10-day and 20-day SMAs are often used as well.
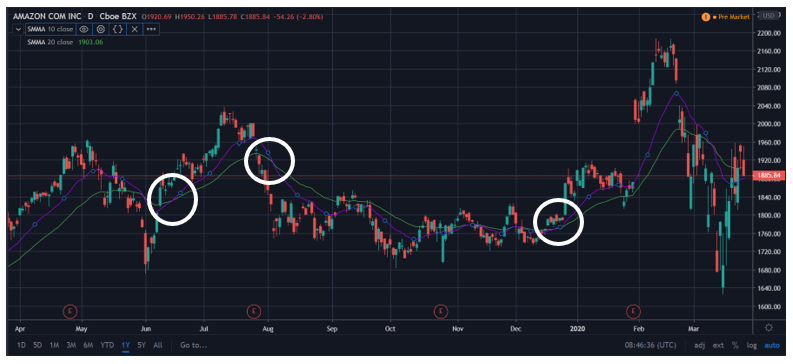
Above, we are looking at Amazon again with 10-day (purple) and 20-day (green) SMA lines. When the 10-day line first crossed above the 20-day line, an investor who bought the stock would ideally capitalize on a two-month upward trend. If the investor sold it right when the 10-day line crossed under the 20-day line, they would’ve exited their position before a couple of months of an overall downtrend.


