Get Certified for Financial Modeling (FMVA)®
Gain in-demand industry knowledge and hands-on practice that will help you stand out from the competition and become a world-class financial analyst.
The excess return that investing in a Canadian bond provides over a risk-free rate
Equity Risk Premium is defined as the excess return that investing in equities provides over a risk-free rate. The variable is a central component in almost every risk-reward model used in finance today, but the way that it is measured may not be appropriate for forward-looking analysis. This guide will look at the Canadian equity risk premium.
We can deconstruct the equity risk premium (the expected return on the S&P/TSX Composite Index less the expected return on a riskless bond) in order to estimate the components:

E(rb) is the expected return on a Government of Canada bond with a maturity of 1 year (alternatively, any maturity equal to the forecast horizon appropriate for the security you wish to value) and E(rs) is the expected return on the S&P TSX Composite index. The expected return can be expressed by the following equation:

Where:
We can further define R1 = Δ(S) * k, where:
Reorganizing the formula above by expanding the denominator, we can break down the expected return on the S&P/TSX Composite Index into two components:

The income return consists of the dividend yield and the repurchase adjustment:

Using data from Bloomberg, the annual dividend yield (calculated as a geometric average of monthly recorded yields) is approximately 3.5%, and the repurchase adjustment (assumed with a 2% repurchase premium) is negligible at slightly higher than 0.1%.
The annual capital gains return as of the year ended 2017 is 8.5%. The number can be found by taking a normal return on the S&P/TSX composite index over the year. The return is consistent with the Bloomberg S&P/TSX Composite index price return.
Adding these components together, we get a YTD total return of approximately 12%. The number is consistent with the Bloomberg S&P/TSX Composite Index total return (including dividends).
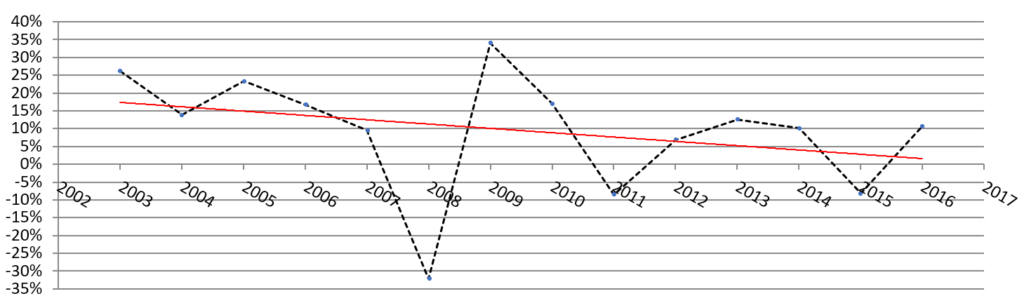
The trend-line in the chart above illustrates the point that the average expected return on the S&P/TSX Composite Index has been declining. The average total return on the TSX Composite can be a proxy for the health of the Canadian economy. With a trend of declining expected returns, we can conclude that it is becoming increasingly challenging to find above-average returns in the Canadian equity market.
This phenomenon can be explained by any number of factors. Since we are analyzing the Canadian equity market, we know that the Canadian dollar is highly correlated with the price of oil. From the start of 2014 to the end of 2015, the crude oil price per barrel fell from a high of US$109.78 per barrel to a low of US$29.64 per barrel. Furthermore, the Canadian household’s debt to disposable income ratio rose from approximately 140% to 175% over the past 10 years, which may have contributed to the pressure on the overall Canadian economy.
From the above analysis, we note that the key component in expected returns is the capital gain return. By replacing P0 = E0 x p0 (where p0 = P0/E0, i.e., the current trailing P/E ratio) and P1 = E1 x p1 (where p1 = P1/E1, i.e., the end-of-period P/E ratio), we can express the capital gain return in terms of earnings growth and as a function of the current and end-of-period P/E ratios:

Where:
Therefore:

Where d1/P0 = $424.31(1+0.0025)/$16,150 = 2.6% (growing at 0.25% CAGR since October 2002) and ra = repurchase adjustment = ![]() , which we can assume to be negligible at a 2% premium. With a short-term GOC bond yield (1-3 of 1.5%, we can estimate the near-term ERP for the Canadian Equity Market by simply adding the terms of the ERP equation:
, which we can assume to be negligible at a 2% premium. With a short-term GOC bond yield (1-3 of 1.5%, we can estimate the near-term ERP for the Canadian Equity Market by simply adding the terms of the ERP equation:
Canadian ERP = 2.6% + 1.1% + 1.8% + 1.2% – 1.5% = 5.2%
The above method can be applied to any major stock market index to solve for the intrinsic equity risk premium for benchmarking expected equity returns over a risk-free rate.
Thank you for reading this guide to the Canadian equity risk premium. CFI is the official provider of the Financial Modeling & Valuation Analyst (FMVA) certification program for financial analysts. To continue advancing your career, these additional resources will be helpful:


