Get Certified for
Capital Markets (CMSA®)
From equities and fixed income to derivatives, the CMSA certification bridges the gap from where you are now to where you want to be — a world-class capital markets analyst.
A measurement technique that estimates the risk of an investment
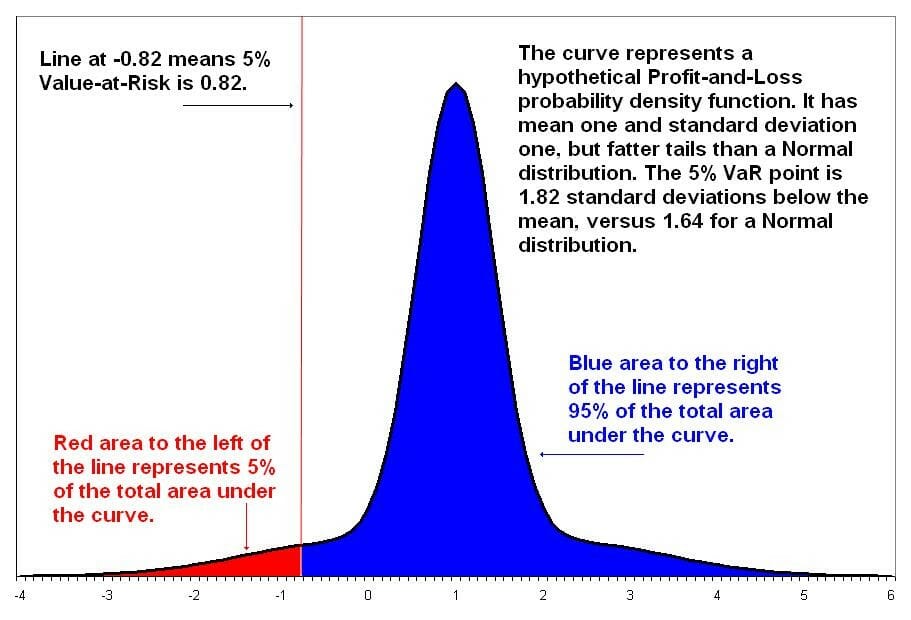
Value at Risk (VaR) is a financial metric that estimates the risk of an investment. More specifically, VaR is a statistical technique used to measure the amount of potential loss that could happen in an investment portfolio over a specified period of time. Value at Risk gives the probability of losing more than a given amount in a given portfolio.
Value at Risk is a single number that indicates the extent of risk in a given portfolio. Value at Risk is measured in either price units or as a percentage. This makes the interpretation and understanding of VaR relatively simple.
Value at Risk is applicable to all types of assets – bonds, shares, derivatives, currencies, etc. Thus, VaR can be easily used by different banks and financial institutions to assess the profitability and risk of different investments, and allocate risk based on VaR.
The Value at Risk figure is widely used, so it is an accepted standard in buying, selling, or recommending assets.
Calculation of Value at Risk for a portfolio not only requires one to calculate the risk and return of each asset but also the correlations between them. Thus, the greater the number or diversity of assets in a portfolio, the more difficult it is to calculate VaR.
Different approaches to calculating VaR can lead to different results for the same portfolio.
Calculation of VaR requires one to make some assumptions and use them as inputs. If the assumptions are not valid, then neither is the VaR figure.
If we have a 95% confidence interval, what is the maximum loss that can occur from this investment over a period of one month?
The historical method is the simplest method for calculating Value at Risk. Market data for the last 250 days is taken to calculate the percentage change for each risk factor on each day. Each percentage change is then calculated with current market values to present 250 scenarios for future value.
For each of the scenarios, the portfolio is valued using full, non-linear pricing models. The third worst day selected is assumed to be 99% VaR.
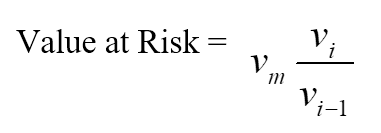
Where:
The parametric method is also known as the variance-covariance method. It assumes a normal distribution in returns. Two factors are to be estimated – an expected return and a standard deviation.
The parametric method is best suited to risk measurement problems where the distributions are known and reliably estimated. The method is unreliable when the sample size is very small.
Let loss be ‘l’ for a portfolio ‘p’ with ‘n’ number of instruments.

Under the Monte Carlo method, Value at Risk is calculated by randomly creating a number of scenarios for future rates using non-linear pricing models to estimate the change in value for each scenario, and then calculating the VaR according to the worst losses.
The Monte Carlo method is suitable for a great range of risk measurement problems, especially when dealing with complicated factors. It assumes that there is a known probability distribution for risk factors.
The marginal value at risk (MVaR) method is the amount of additional risk that is added by a new investment in the portfolio. MVaR helps fund managers to understand the change in a portfolio due to the subtraction or addition of a particular investment.
An investment may individually have a high Value at Risk, but if it is negatively correlated with the portfolio, it may contribute a relatively much lower amount of risk to the portfolio than its standalone risk.
Incremental VaR is the amount of uncertainty added to, or subtracted from, a portfolio due to buying or selling of an investment. Incremental VaR is calculated by taking into consideration the portfolio’s standard deviation and rate of return, and the individual investment’s rate of return and portfolio share. (The portfolio share refers to what percentage of the portfolio the individual investment represents.)
This is also known as the expected shortfall, average value at risk, tail VaR, mean excess loss, or mean shortfall. CVaR is an extension of VaR. CVaR helps to calculate the average of the losses that occur beyond the Value at Risk point in a distribution. The smaller the CVaR, the better.
Connect what you just learned to a clear career path with CFI’s role‑based courses and certification programs.
Thank you for reading CFI’s guide on Value at Risk (VaR). To keep learning and advance your career, the following resources will be helpful:


