Get Certified for Financial Modeling (FMVA)®
Gain in-demand industry knowledge and hands-on practice that will help you stand out from the competition and become a world-class financial analyst.
Tools that can be used to describe business processes that contain large amounts of information
Flowcharts are great for describing business processes concisely without compromising on structure and detail. They allow users to summarize large amounts of information in a relatively little space. In addition, good flowcharts can improve the quality and accessibility of business reports. Below are four sample flowchart templates that should serve as a good starting point for an analyst looking to learn more information about some common flowcharts.

Although no special tools or software are needed to make flowcharts (one can simply arrange shapes and arrows in a word processor such as Microsoft Word), certain tools can greatly reduce the time required to create them. Microsoft Word’s SmartArt section contains a large collection of flowchart templates that can be freely used by all users.
One great free online tool for more specialized flowcharts is Draw.io. The Multi-Level Single Process Flowchart, the Decision Tree Flowchart, and the Venn Diagram can be made using Draw.io.
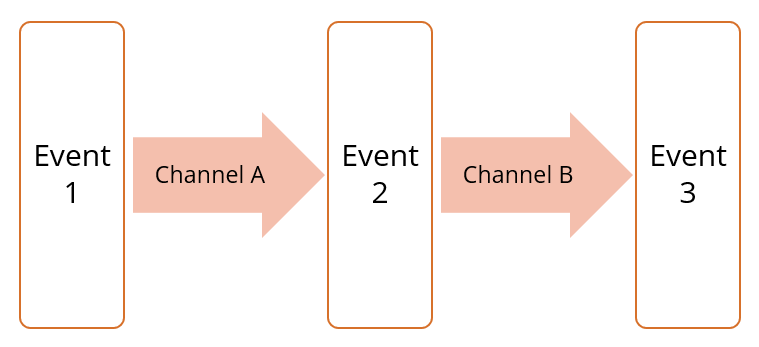
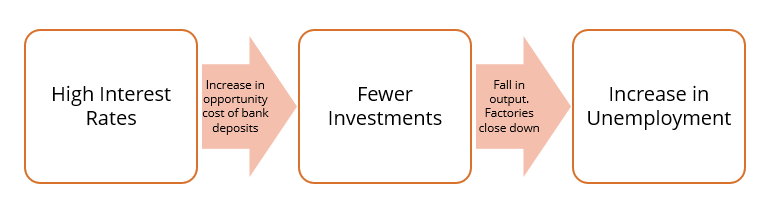
The Multi-Stage Single Process Flowchart template can be found in Microsoft Word’s SmartArt section and is free to use. Event 1 leads to Event 2 via Channel A. Event 2 leads to Event 3 via Channel B. For example, an analyst wants to write about the link between high interest rates and high unemployment.
Decision trees allow analysts to describe in detail how and when businesses make decisions. An investor just put in $1,000,000 in a tech startup. Six months after the initial investment, the start-up asks for more money. The investor needs to decide now: Should I invest more in the business? If yes, how much should I invest?
The decision tree below and the following paragraphs both provide a complete description of the investor’s investment plan. They take up roughly the same amount of space on the page, but the paragraphs contain a total of 256 words and are quite verbose.


Venn diagrams are another great graphical tool that should be part of every financial analyst’s repertoire. Below, we use a Venn diagram to distinguish between the necessary conditions for investment and the sufficient conditions for investment.
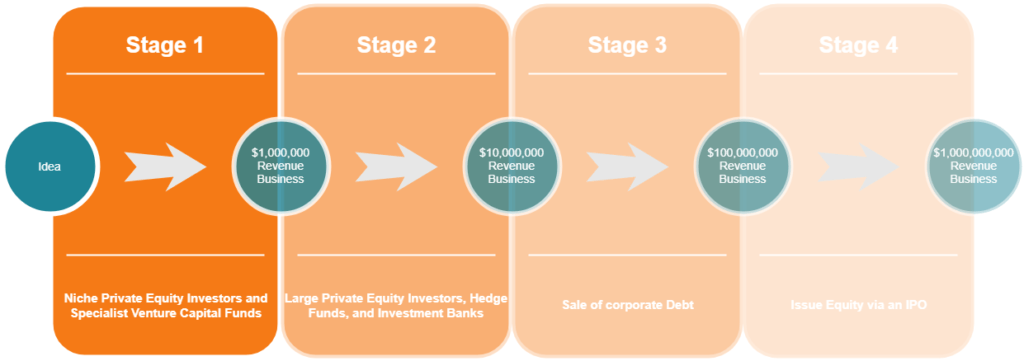
Funding Stage 1: A tech startup uses money from niche private equity investors and specialist venture capital funds to increase the size of their operation and generate revenues more than $1,000,000.
Funding Stage 2: The business then uses money from large private equity investors, hedge funds, and investment banks to increase the size of their operation and generate revenues more than $10,000,000.
Funding Stage 3: The business issues a large amount of corporate debt and uses this money to increase the size of their operations and generate revenues more than $100,000,000.
Funding Stage 4: The business lists itself on a stock exchange and issues shares to the public via an IPO. The business uses this money to increase the size of their operations and generate revenues of more than $1,000,000,000.
CFI is the official provider of the global Financial Modeling & Valuation Analyst (FMVA)™ certification program, designed to help anyone become a world-class financial analyst. To keep advancing your career, the additional resources below will be useful:


