Get Certified for Financial Modeling (FMVA)®
Gain in-demand industry knowledge and hands-on practice that will help you stand out from the competition and become a world-class financial analyst.
In a leveraged buyout (LBO), generating strong equity returns is the goal. To understand how those returns were achieved, investors and analysts look beyond the bottom-line internal rate of return (IRR) or cash-on-cash metrics. They want to know what actually created the value.
That’s why every LBO model should include returns attribution data. An LBO returns attribution analysis breaks down equity value creation into its component parts — helping you see what drove the return: operational performance, valuation changes, or financial structuring.
This guide breaks down the definition and components of LBO returns attribution, how it’s calculated, and what insights it reveals.
LBO returns attribution is the process of breaking down the change in equity value over the holding period into its core components: EBITDA growth, multiple expansion, and net debt paydown.
This analysis helps investors understand what actually drove the return — whether it came from operational improvements, valuation changes, or paying down debt. Attribution analysis brings transparency and accountability to investment outcomes.
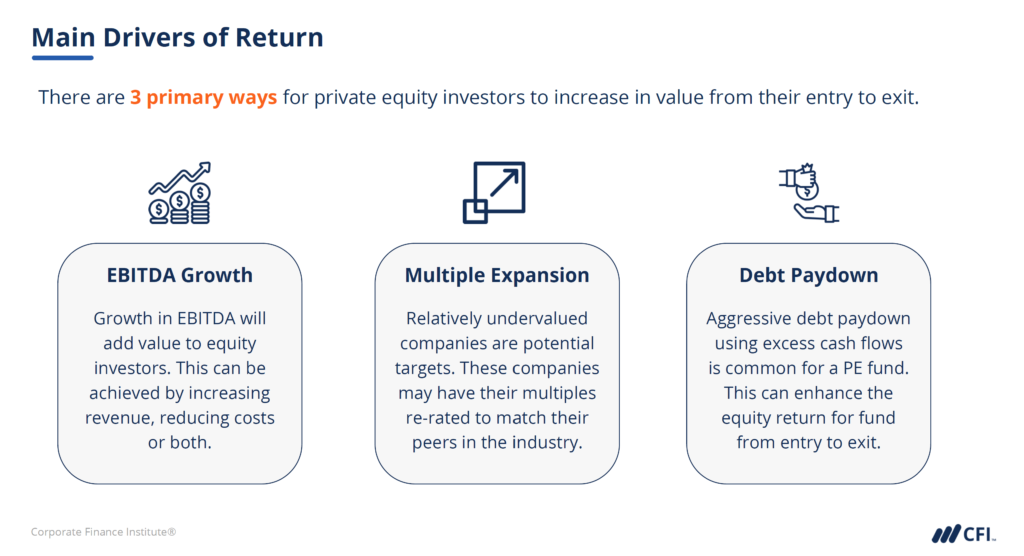
LBO returns attribution is a structured way to analyze where equity value creation came from in a leveraged buyout. The goal is to break down total returns into three distinct components:
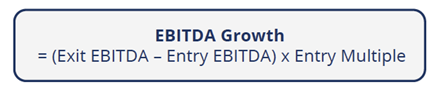
| EBITDA Growth | Growth in earnings before interest, taxes, depreciation, and amortization | Entry EBITDA, Exit EBITDA, Entry Multiple |
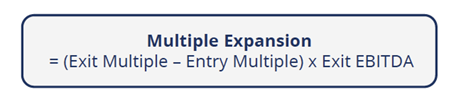
| Multiple Expansion | Change in valuation multiple (market re-rating) | Entry Multiple, Exit Multiple, Exit EBITDA |
| Net Debt Paydown | Equity gained from reducing debt | Entry Net Debt, Exit Net Debt |
Before diving into the component formulas, it’s helpful to understand the distinction between EBITDA growth and multiple expansion:
So, if EBITDA increases, the company is generating more profit. If the multiple increases, the market is willing to assign a higher value to each dollar of profit. Both factors contribute to the final equity value, but for different reasons — performance vs. perception.
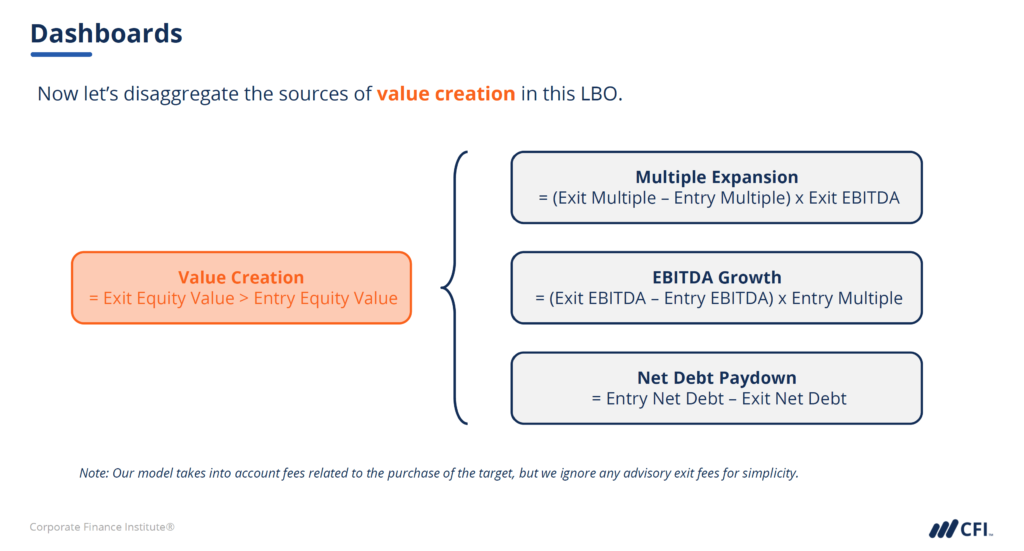
Here’s how the value creation from each return driver is calculated:
1. EBITDA Growth Contribution: Shows how much value came from the company improving its operating earnings.
2. Multiple Expansion Contribution: Measures the change in valuation the market applies to the business.
3. Net Debt Paydown Contribution: Captures the increase in equity from reducing debt over time.

The sum of these components equals the total increase in equity value.
Equity returns in an LBO are driven by specific, measurable factors that private equity analysts need to understand clearly. While IRR and cash-on-cash return tell you how much value was created, attribution analysis explains where that value came from through EBITDA growth, multiple expansion, or net debt paydown.
By making the sources of equity value creation fully transparent, LBO returns attribution adds depth to your analysis. It allows you to isolate the impact of each value driver and communicate results more clearly to investors and stakeholders.
If you’re looking to sharpen your LBO modeling skills and apply this kind of analysis with confidence, specialized training can help you get there.
Ready to level up your LBO modeling expertise? CFI’s Investment Banking & Private Equity Modeling Specialization equips you with job-ready skills in advanced financial modeling (DCF, LBO, and M&A), valuation, forecasting, and transactional decision making. Learn the techniques used by finance professionals at JPMorgan, BlackRock, KKR, and more!
LBO Modeling Step-by-Step Guide
Demystifying Leveraged Buyout Returns


