Downtrend
The movement of a stock towards a lower price from its previous state
What is a Downtrend?
A downtrend describes the movement of a stock towards a lower price from its previous state. It will exist as long as there is a continuation of lower highs and lower lows in the stock chart. The downtrend is reversed once the conditions are no longer met.
For example, after a sustained period of a downtrend, the market may reverse back to an uptrend. The downtrend and uptrend cycles will fluctuate, and the timing of each occurrence is always different. As the length and duration of a downtrend may vary, traders can trade a downtrend through a daily, weekly, monthly, or even one-minute period.
Summary
- A downtrend describes the movement of a stock towards a lower price from its previous state. It will exist as long as there is a continuation of lower highs and lower lows in the stock chart.
- A trader may potentially save money if they decide to sell off a declining stock. Meanwhile, other traders look to profit from a downtrend by purchasing at an attractive valuation or short selling.
- A downtrend can be identified and understood through various forms of technical analysis. One simple area of technical analysis is the use of trendlines. Another simple area of technical analysis is the moving average technical indicator.
Understanding and Identifying Downtrends
As much as it is important to look out for uptrends when trading, it is equally important to understand and identify downtrends. A trader may potentially save money if they decide to sell off a declining stock. If many traders decide to sell a stock at the same time, it will result in a sharp decline in the stock price. The stock market is sentiment-driven, and fear of a further decline may result in even further selloffs of a stock.
Some traders that frequently day trade may decide to implement stop-loss orders to protect themselves against a downtrend. A stop-loss order placed with a broker helps a trader sell once the price of the security reaches a certain price. Downtrends can vary from a gradual continuation to a sharp decline. A sharp decline may occur as a result of news-related topics, such as a poor quarterly earnings report or loss of a lawsuit.
A downtrend can be identified and understood through various forms of technical analysis. One simple area of technical analysis is the use of trendlines. Trendlines connect a series of high or low points. The reversal of a declining trendline signals an uptrend.
Another simple area of technical analysis is the moving average technical indicator. The moving average takes the mean of prices over a period in the past. If the price of a stock tends to stay below the moving average, it signals that the price is on a downtrend.
Trading on a Downtrend
Many traders look to profit from sell offs of a stock. While many traders will sell, taking the view that a price will decrease further in the future, some traders take the opposite view of hoping for a price increase. Downtrends may also lead to attractive valuation and present new opportunities for traders to purchase shares of stock.
In another sense, downtrends allow traders to make money by short-selling stocks. In order to short a stock, a trader borrows shares and immediately sells them, in hopes that the price will fall. If the price of the stock goes down, then the individual will repurchase the shares back at the lower price and return the borrowed shares. The difference between the old price and the new price is the profit that a short-selling trader holds.
Downtrend Chart Example
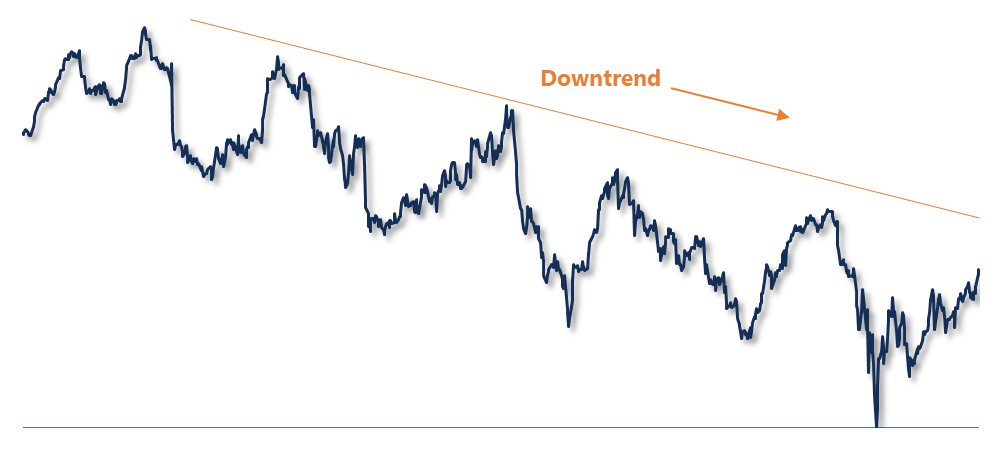
As seen in the image above, the stock chart in a downtrend will slope downwards in a series of descending peaks and descending troughs. Peaks are the higher points on a chart, while a trough is a low point from which the next uptrend will begin.
A sustained downtrend over a long period of time may be a potential indicator of the market’s negative sentiment to that business or industry. With a stock market correction or crash, it may signal an economic contraction. As the economy contracts, it may lead to higher unemployment and a decline in consumer spending.
Additional Resources
CFI is the official provider of the global Commercial Banking & Credit Analyst (CBCA)™ certification program, designed to help anyone become a world-class financial analyst. To keep advancing your career, the additional CFI resources below will be useful:


