Get Certified for
Capital Markets (CMSA®)
From equities and fixed income to derivatives, the CMSA certification bridges the gap from where you are now to where you want to be — a world-class capital markets analyst.
Portion of additional disposable income that is saved by a consumer
The marginal propensity to save (MPS) refers to the portion of additional disposable income that is saved by a consumer. The MPS for any individual reflects how much one is willing to save, usually a fraction, for each added dollar of income.

For example, if the MPS is 10%, it means that individuals save $10 for every $100 earned. In Keynesian economics, economists used MPS to quantify the relationship between any changes in income and saving. The term can also refer to the whole economy to show what the entire household sector does with the percent of additional income that is saved. The slope of the saving line can be presented on a graph to analyze MPS.
Marginal propensity to save reflects important aspects of a household’s expenditure habits since saving and consumption go hand in hand. It also paints a picture of the saving amount from a country’s economy.
Also called leakage, a saving amount is the fraction of income that is not injected back into the economy through consumption. The amount is expressed as a percentage, and a higher proportion indicates that an individual receives a higher income and hence demonstrates a greater ability to satisfy their needs.
Usually, a higher income translates to a higher MPS. As people become wealthier, it becomes easier to satisfy their needs, and the additional income earned is more likely to go into savings rather than meet household expenditures.
Still, a higher income may change the consumption habits of an individual and may develop an increased desire for luxury goods and services, such as high-end vehicles, better neighborhoods, and lavish holidays.
Marginal propensity to save also plays a key role in determining the multiplier effect. A multiplier measures a change in the market value of all products produced within a country’s borders, such as the Gross Domestic Product (GDP). It results from a change in the autonomous variable, such as government expenditure.
A change in the production process creates a multiplier effect because it creates an additional disposable income that is spent on consumption. The new consumption creates an income for another sector in the economy, which triggers more consumption and a further change in the production process.
The cycle continues leading to a magnified and multiplied change in maximum output. The spending multiplier is expressed as the inverse of MPS.

The spending multiplier shows how adjustments in consumers’ MPS affect the rest of the economy. The opposite of MPS is the marginal propensity to consume (MPC), which refers to the additional consumer spending triggered by an increase in disposable income.
The formula below is used in calculating MPS:
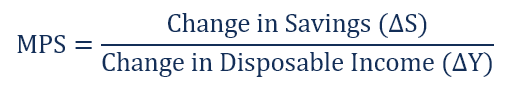
The saving changes by the value of MPS if the income changes by a dollar. MPS is equivalent to the saving function slope. In the curve, the horizontal line (x-axis) represents a change in income, while the vertical line (y-axis) represents a change in saving.
Points to note about MPS:
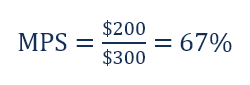
Suppose that John receives a $300 bonus with his paycheck. It means that John has $300 in additional income. If he spends $100 of this marginal increase in purchasing a new pair of shoes and saves the remaining $200, his marginal propensity to save is (using the formula above):
This value is important because MPS is not constant. Seasonal trends usually emerge monthly as margins change to heavy spending during holidays, with less active consumer spending months registering high saving levels. Economists use MPS in measuring the correlation between such trends to give the general economic picture of the population.
The marginal propensity to consume differs from MPS. In the above equation, MPC is calculated as follows:
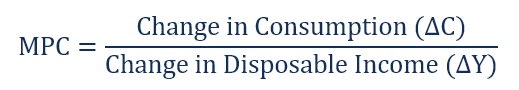

It means that for every dollar earned, 33 cents is spent on consumption while 67 cents is spent on savings. Adding MPC (0.33) to MPS (0.67) equals to 1.
CFI is the official provider of the Capital Markets & Securities Analyst (CMSA®) certification program, designed to transform anyone into a world-class financial analyst.
In order to help you become a world-class financial analyst and advance your career to your fullest potential, these additional resources will be very helpful:


