Get Certified for
Capital Markets (CMSA®)
From equities and fixed income to derivatives, the CMSA certification bridges the gap from where you are now to where you want to be — a world-class capital markets analyst.
A trendline drawn below a head and shoulders pattern that is used in technical analysis
Neckline refers to a trendline drawn below a head and shoulders pattern that is used in technical analysis that signals buying opportunities to investors. It is drawn along the support and resistance points of various consolidation and reversal patterns. It connects the low points of the head and shoulders pattern, following the first two peaks.

The neckline is used by traders to determine the strategic areas to place orders. The price of the stock falling below the neckline may indicate a reversal in trends of the stock price.
The neckline drawn represents a support level, and it cannot be assumed that a head and shoulders pattern has been completed until the support level has been broken. One must be careful while analyzing the breakthroughs, as a break greater than 3%-4% may be a cause of concern.
A stock may drift through the neckline due to small volume, and the price may rise. However, the rally normally does not cross the general level of neckline before an increase in selling pressure leads to a price decrease with greater volume.
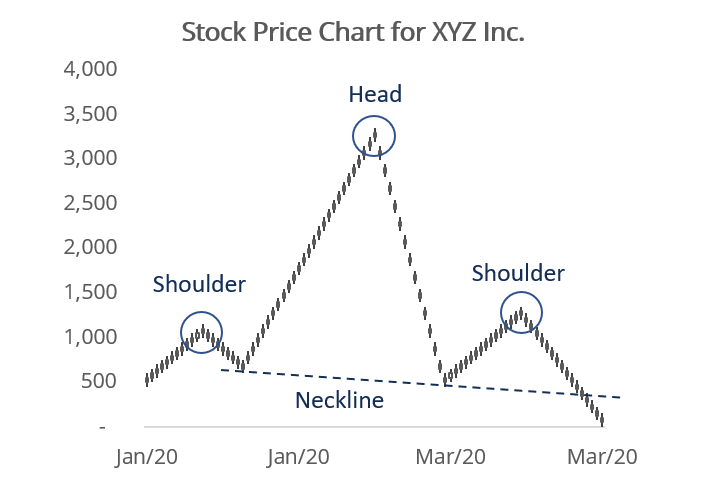
In the chart above, the stock price movement of XYZ Inc. forms a head and shoulders pattern by forming shoulders at the first and third peaks and the head at the second peak with retracements between them.
The neckline connects the two lowest points of the stock price during the trading period. A price decline below the neckline following the third peak may suggest a reversal of the uptrend and that the stock price might decline further.
The stock trading volume may also play an important role in the head and shoulders pattern. A higher volume during the advance of the left shoulder coupled with a low volume during the advance of the head and the new high of the head signal a warning sign.
The next warning sign appears when volume decreases during the decline from the peak of the head, followed by increasing volume during the decline of the right shoulder.
Price Target Using the Head and Shoulders Top Pattern
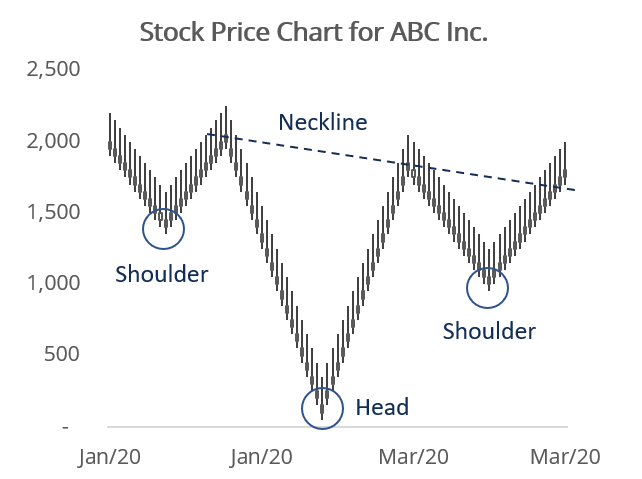
In the chart above, the stock price movement of ABC Inc. forms an inverse head and shoulders pattern by forming shoulders at the first and third troughs and the head at the second trough with retracements between them.
The neckline connects the two highest points of the stock price during the trading period. An increase in price above the neckline following the third trough may suggest a reversal of the downtrend and that the stock price might increase further.
Price Target using an Inverse Head and Shoulders Pattern
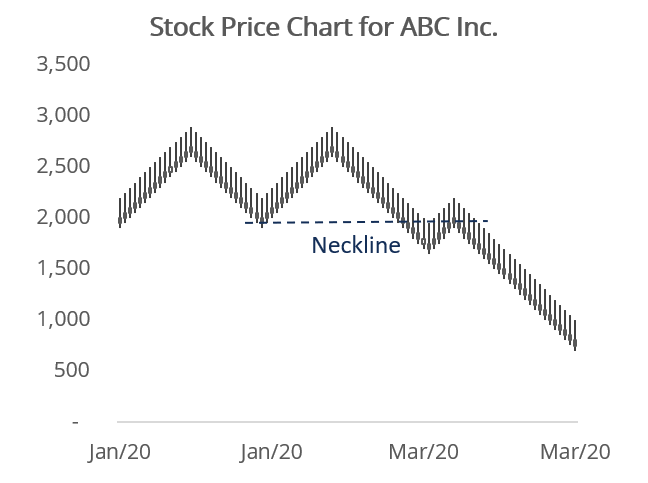
In a double top pattern, the stock price movement tests the resistance level twice but is unable to break the same, and the price declines after the third peak. In the double top pattern, the neckline is formed by connecting the first trough and the third peak.
A double bottom pattern is the inverse of the double top pattern, where the stock price movement tests the support level twice, enters a new trend, and heads upwards.
CFI is the official provider of the global Capital Markets & Securities Analyst (CMSA®) certification program, designed to help anyone become a world-class financial analyst. To keep advancing your career, the additional resources below will be useful:


