Get Certified for
Capital Markets (CMSA®)
From equities and fixed income to derivatives, the CMSA certification bridges the gap from where you are now to where you want to be — a world-class capital markets analyst.
A risk management technique based on the criterion that the probability of a portfolio’s return dropping below a threshold level return is reduced
Roy’s safety-first criterion is a risk management technique used by investors to compare and choose a portfolio based on the criterion that the probability of a portfolio’s return dropping below a threshold level return is reduced.
In Roy’s safety-first criterion, the optimal portfolio is one that minimizes the probability of the portfolio’s return falling below a threshold return level. The portfolio with the highest Roy’s safety-first criterion has the lowest probability of a portfolio generating a return lower than the threshold level return.

Where:
Note that the formula for Roy’s safety-first criterion assumes that portfolio returns are normally distributed.
Where:
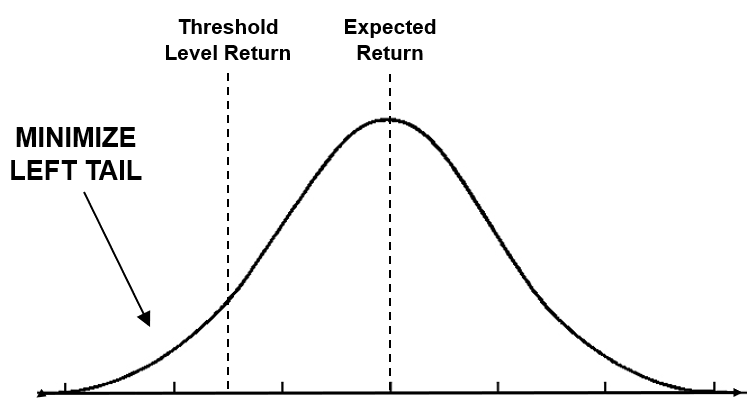
The goal of Roy’s safety-first criterion is to minimize the left tail. The area to the left of the threshold level return is the probability of the portfolio generating a return less than the threshold.
The value given by Roy’s safety-first criterion indicates the number of standard deviations below the mean. For example, a value of 1 indicates one standard deviation below the mean. Therefore, the higher the criterion value, the smaller the left tail and the lower the probability of the portfolio generating a return less than the threshold.
Shortfall risk and Roy’s safety-first criterion go hand-in-hand. Shortfall risk is the probability of generating a return lower than the threshold level return. In other words, shortfall risk is the area to the left of the threshold level return on a normal distribution graph. It is important to note that:
The higher the safety-first criterion, the lower the shortfall risk.
The lower the safety-first criterion, the higher the shortfall risk.
The shortfall risk can be calculated through a z-table for negative values. Below, we will do a comprehensive example.
For example, consider a portfolio with an expected return of 5%, a standard deviation of 10%, and a threshold return level of 0%. What are Roy’s safety-first criterion and shortfall risk, assuming that the portfolio is normally distributed?
The Roy’s safety-first criterion is calculated as (5% – 0%) / 10% = 0.5.
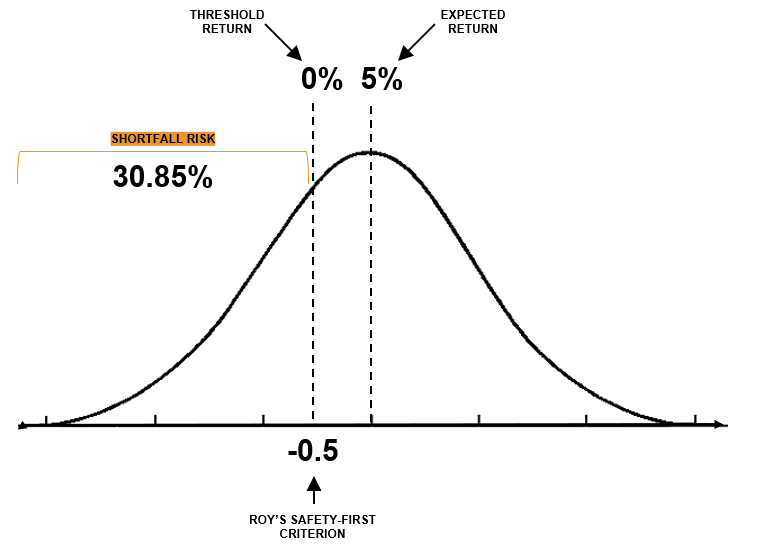
Illustrated above, the expected return is 5%, the threshold return is 0%, and Roy’s safety-first criterion yields 0.5, which is 0.5 standard deviations below the expected return. Shortfall risk is the area under the curve starting from the left of the threshold return. Using a z-table for negative values, -0.5 corresponds to a z-score of 0.3085 or 30.85%.
Consider three portfolios with the return and risk profiles provided below. Assume that the investor wants to minimize the probability of the portfolio returning less than 0%. In other words, the investor’s minimum acceptable return is 0%. Based on Roy’s safety-first criterion, which portfolio should the investor invest in?
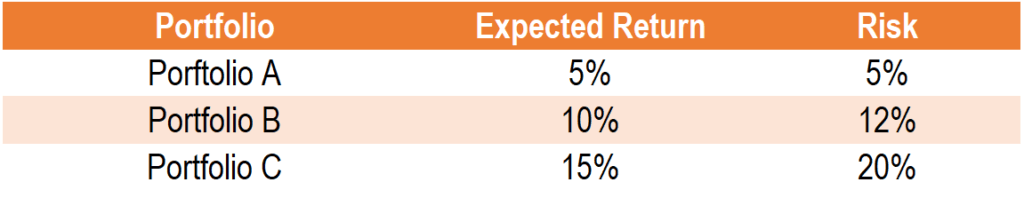
The Roy’s safety-first criterion for Portfolio A is calculated as (5% – 0%) / 5% = 1.
The Roy’s safety-first criterion for Portfolio B is calculated as (10% – 0%) / 12% = 0.83.
The Roy’s safety-first criterion for Portfolio C is calculated as (15% – 0%) / 20% = 0.75.
Based on Roy’s safety-first criterion, the ratio with the largest safety-first criterion has the lowest probability of getting a return of less than 0%. In our example, it would be Portfolio A.
CFI is the official provider of the Capital Markets & Securities Analyst (CMSA®) certification program, designed to transform anyone into a world-class financial analyst.
To keep learning and developing your knowledge of financial analysis, we highly recommend the additional resources below:


