Overview
Power BI Financial Statements Overview
Welcome to the most comprehensive Financial Statements in Power BI walkthrough ever. In this case study, you’ll practice your BI skills by taking on the role of a Business Intelligence Developer. You will be helping a retail company automate and visualize its most important financial statements. Creating Financial Statements in Power BI poses three significant challenges, which we will help you solve using a combination of BI tools.- Challenge 1: How to replicate financial statement layouts and formatting
- Challenge 2: How to create account subtotals and other DAX summaries
- Challenge 3: How to create the more complex cash flow statement
Interactive Financial Statements in Power BI
Power BI offers a great way to visualize and interact with high-level financial data.Power BI Financial Statements Learning Objectives
Upon completing this course, you will be able to:- Understand how to define and propose an achievable project scope.
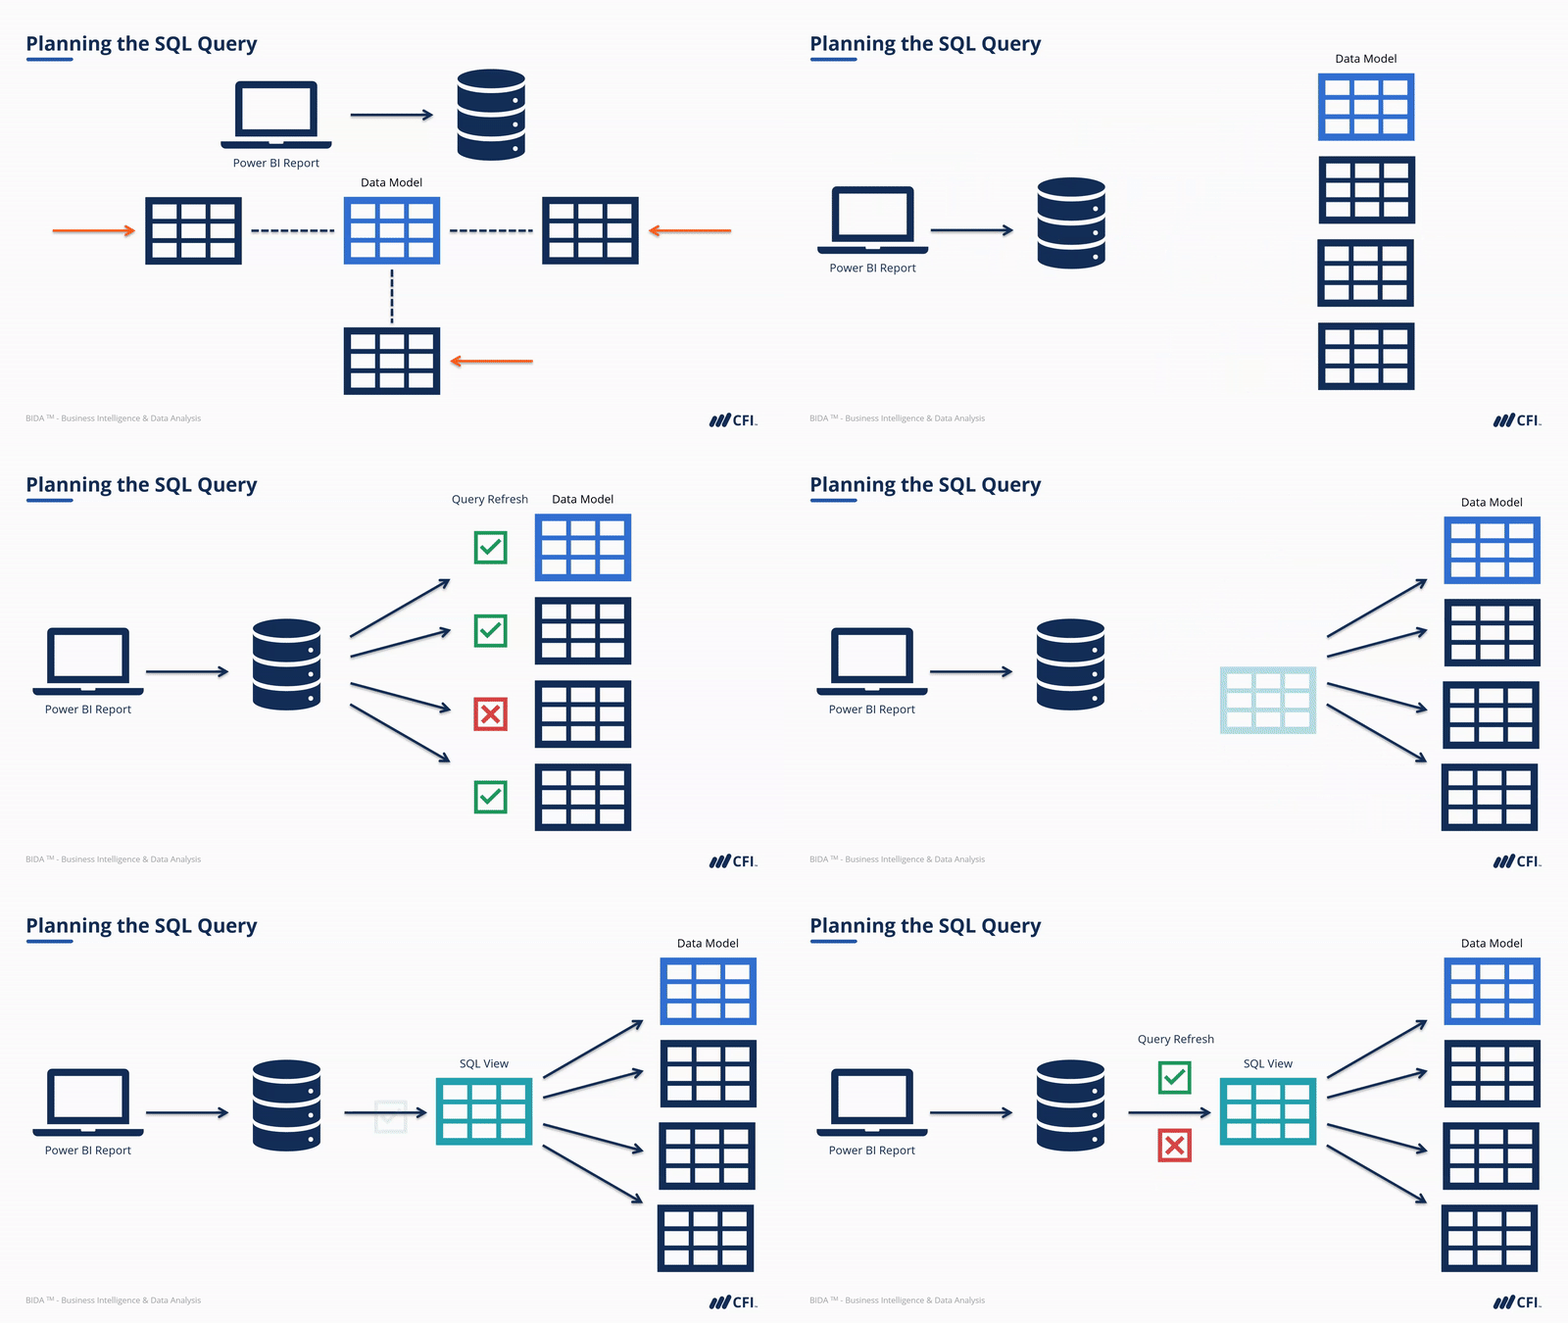
- Write an SQL query to source General Ledger Data from a database
- Build a data model using a snowflake schema in Power BI
- Build an Income Statement and Balance Sheet in Power BI
- Create financial statements in Excel using Cube Formulas
- Compare the benefits of Power BI vs. Excel for Financial Analysis
Who should take this course?
This course is perfect for anyone who wants to apply their Power BI and DAX skills in a real-world scenario. There is no better way to kick-start a career in data analysis, quantitative analysis, business intelligence, or other areas of finance with applied, practical knowledge of Power BI and related BI tools.Prerequisite Courses
Recommended courses to complete before taking this course.
Power BI Financial Statements
Level 4
3h 20min
100% online and self-paced
Field of Study: Finance
Start LearningWhat you'll learn
Case Study Introduction
Extract Data from the Database
Create the Data Model in Power Query
Income Statement in Power BI
Balance Sheet in Power BI
Analyze in Excel with Cube Formulas
Case Study Summary
Qualified Assessment
This Course is Part of the Following Programs
Why stop here? Expand your skills and show your expertise with the professional certifications, specializations, and CPE credits you’re already on your way to earning.
Business Essentials Certificate
- Skills Learned Microsoft Excel, Word, PowerPoint, Business Communication, Data Visualization, Ethics
- Career Prep Sales Skills, People Management Skills, Relationship Management Skills, Business Analysis Skills
Business Intelligence Analyst Specialization
- Skills learned Data Transformation & Automation, Data Visualization, Coding, Data Modeling
- Career prep Data Analyst, Business Intelligence Specialist, Finance Analyst, Data Scientist


