Get Certified for Financial Modeling (FMVA)®
Gain in-demand industry knowledge and hands-on practice that will help you stand out from the competition and become a world-class financial analyst.
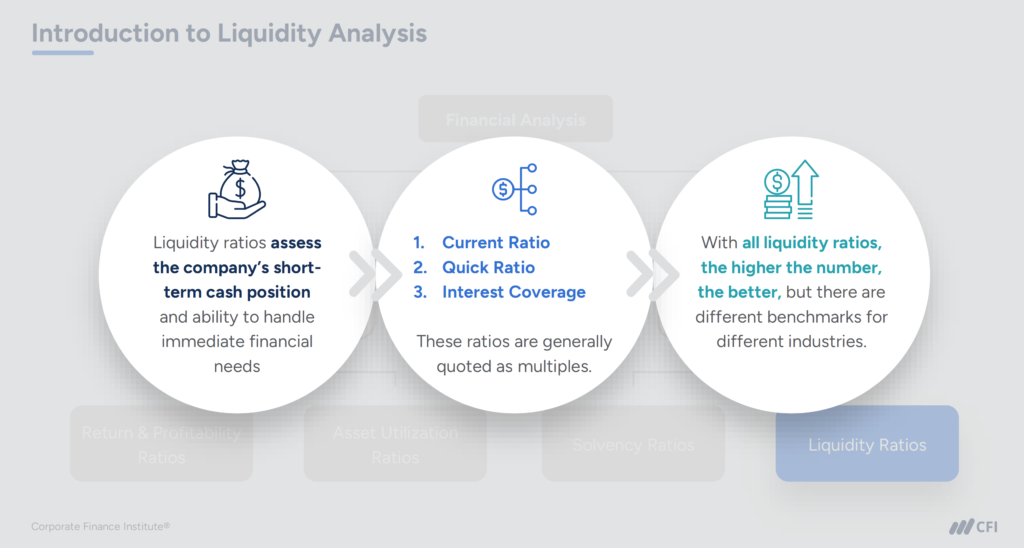
Current ratio and quick ratio are two key liquidity ratios that provide complementary perspectives on a company’s short-term financial health. Both ratios assess a company’s short-term cash position and its ability to handle immediate financial needs and obligations.
Liquidity ratios, such as the current and quick ratios, assess a company’s ability to convert assets into cash quickly and cost-effectively. These ratios help analysts, investors, and company leadership understand whether a business can meet its short-term obligations without disrupting operations.
The difference between the current ratio and quick ratio lies in what liquid assets are included in each ratio’s calculation and how each ratio is interpreted.
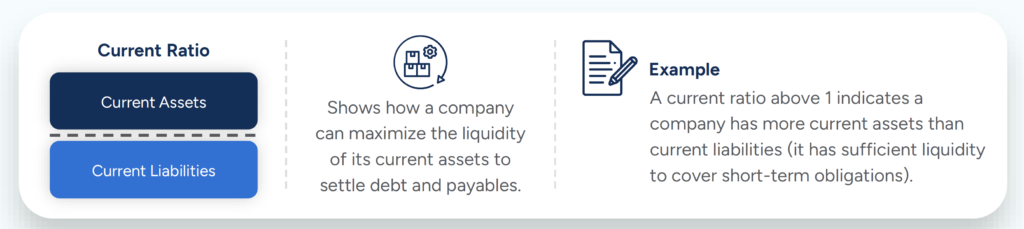
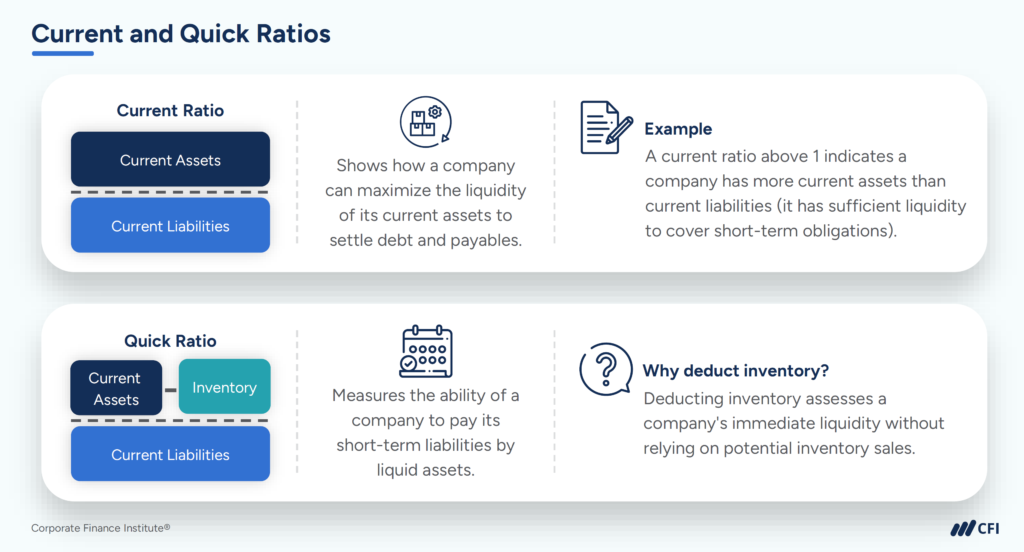
The current ratio, also known as the working capital ratio, measures a business’s ability to meet its short-term obligations that are due within a year. This ratio compares total current assets to total current liabilities. It also looks at how a company can maximize the liquidity of its current assets to settle its liabilities and debt obligations.
The current ratio is calculated by dividing total current assets by total current liabilities:
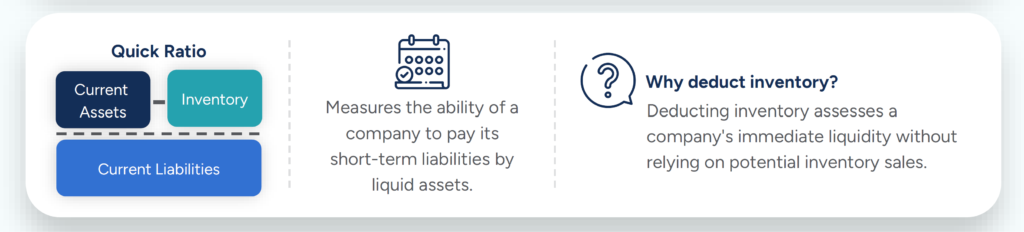
The quick ratio, also known as the Acid Test Ratio, measures the ability of a business to pay its short-term liabilities. But unlike the current ratio, the quick ratio limits assets to cash or other assets that a company can swiftly convert into cash. Therefore, the quick ratio excludes accounts like inventory and prepaid expenses.
The quick ratio is usually calculated by subtracting inventory from the total current assets and dividing the result by total current liabilities:
The current ratio is more comprehensive than the quick ratio, as it includes all current assets from the balance sheet — cash, marketable securities, accounts receivable, and inventory.
Another way to understand the difference is that a quick ratio only looks at the most liquid assets, which is a stricter assessment of a company’s immediate liquidity. For example, inventory is a company asset that relies on sales to generate cash. Depending on sales cycles, it may take time for inventory to sell, i.e., convert into cash, thus making it less “quick” than other current assets.

Suppose you’re analyzing a company that holds the following assets and liabilities on its balance sheet:
Assets
Liabilities
Using the current ratio formula (Current Ratio = Current Assets ÷ Current Liabilities), you perform the following calculation:
Typically, a current ratio greater than 1.0 suggests financial well-being for a company. A current ratio of 2.0 means that the company could pay off its current liabilities twice with its current assets.
Now suppose you want to assess the same company’s liquidity position with a more conservative measurement — the quick ratio.
In contrast with the current ratio, the Quick Ratio excludes inventory from current assets before dividing by current liabilities:
You calculate the company’s current ratio as follows:
The quick ratio of 1.17 indicates the company can pay off its current liabilities 1.17 times using only its most liquid assets, without relying on inventory sales.
For an even more conservative liquidity ratio, analysts sometimes subtract prepaid expenses, or future expenses paid in advance, as well as inventory from current assets. To calculate a quick ratio with this approach, use the following formula:
A strong current ratio signals flexibility. It shows the company has enough accessible resources to cover near-term financial obligations — and maybe even some breathing room. But too much of a cushion can raise questions about underutilized capital.
The quick ratio helps you gauge how easily a company could respond to immediate financial pressure — without relying on inventory or other assets that take time to liquidate. It’s a more conservative read on liquidity, especially useful when speed matters.
Looking at both ratios side by side helps you understand how much the company depends on inventory to stay liquid.
Bottom line: Neither ratio tells the full story on its own. Use them together to spot patterns, assess risk, and benchmark against industry norms. That’s how you turn numbers into insight.
When it comes to the current ratio and quick ratio, both measures provide essential perspectives on a company’s liquidity position. Rather than choosing between them, use both ratios as complementary measures that provide a fuller picture. Track these two ratios over time to identify trends and always compare them against industry benchmarks for meaningful context.
Financial ratio analysis, including these liquidity metrics, is covered in depth in CFI’s Financial Analysis Fundamentals course, a core requirement in the FMVA® certification program.
CFI’s Financial Modeling & Valuation Analyst (FMVA®) certification is one of the most recognized programs for learning financial modeling skills. It’s designed for professionals pursuing careers in investment banking, equity research, FP&A, corporate finance, and related fields. Over 75% of CFI learners report significant career advancement within months of program completion.
The FMVA program provides the structured path and hands-on training you need to build real-world modeling skills and apply them with confidence in any corporate finance environment.
Financial Ratios Definitive Guide
ROA vs. ROE: Differences, Formulas, and Uses in Financial Analysis
Negative Working Capital: Strength or a Warning Sign?


