Get Certified for
Business Intelligence (BIDA®)
Develop analytical superpowers by learning how to use programming and data analytics tools such as VBA, Python, Tableau, Power BI, Power Query, and more.
The iterative practice of turning data into actionable insights
Business intelligence (BI) is the practice of turning data into actionable insights. BI helps decision-makers to create better strategies and tactics going forward by enabling them to understand patterns and trends in data.
BI is an ongoing practice, constantly evolving to better understand business requirements, and to provide more relevant, accurate, and detailed data to help answer business questions. With this evolving nature, it’s important to understand the business intelligence cycle from beginning to end.
The BI cycle can be broken down into a few key steps:
Before we write a formula or create a single chart, we need to understand the requirements of the business, their biggest challenges, and the questions they’d love to be able to answer. This first step relies heavily on business and industry knowledge, so it’s important that the BI team either has that expertise or that they collaborate with decision makers who do.
The requirements phase of the BI cycle focuses on answering the following types of questions:
In this way, we’re starting our business intelligence workflow by looking first at the finish line. By setting our eye on a defined target, we’ll have a much better idea of what we need to accomplish. We can then develop a roadmap for how to get there.
Note: BI projects are notorious for scope creep, where business stakeholders slowly increase their requirements. Defining “what finished looks like” is essential to project completion.
First, data is collected from various sources including internal company data and external market data. It is often stored in databases, data warehouses, and files. Typically, the sourcing of large-scale external data will be done by a data engineer. Once the source data is organized and ready for use, the business intelligence analyst can begin their part of the process.
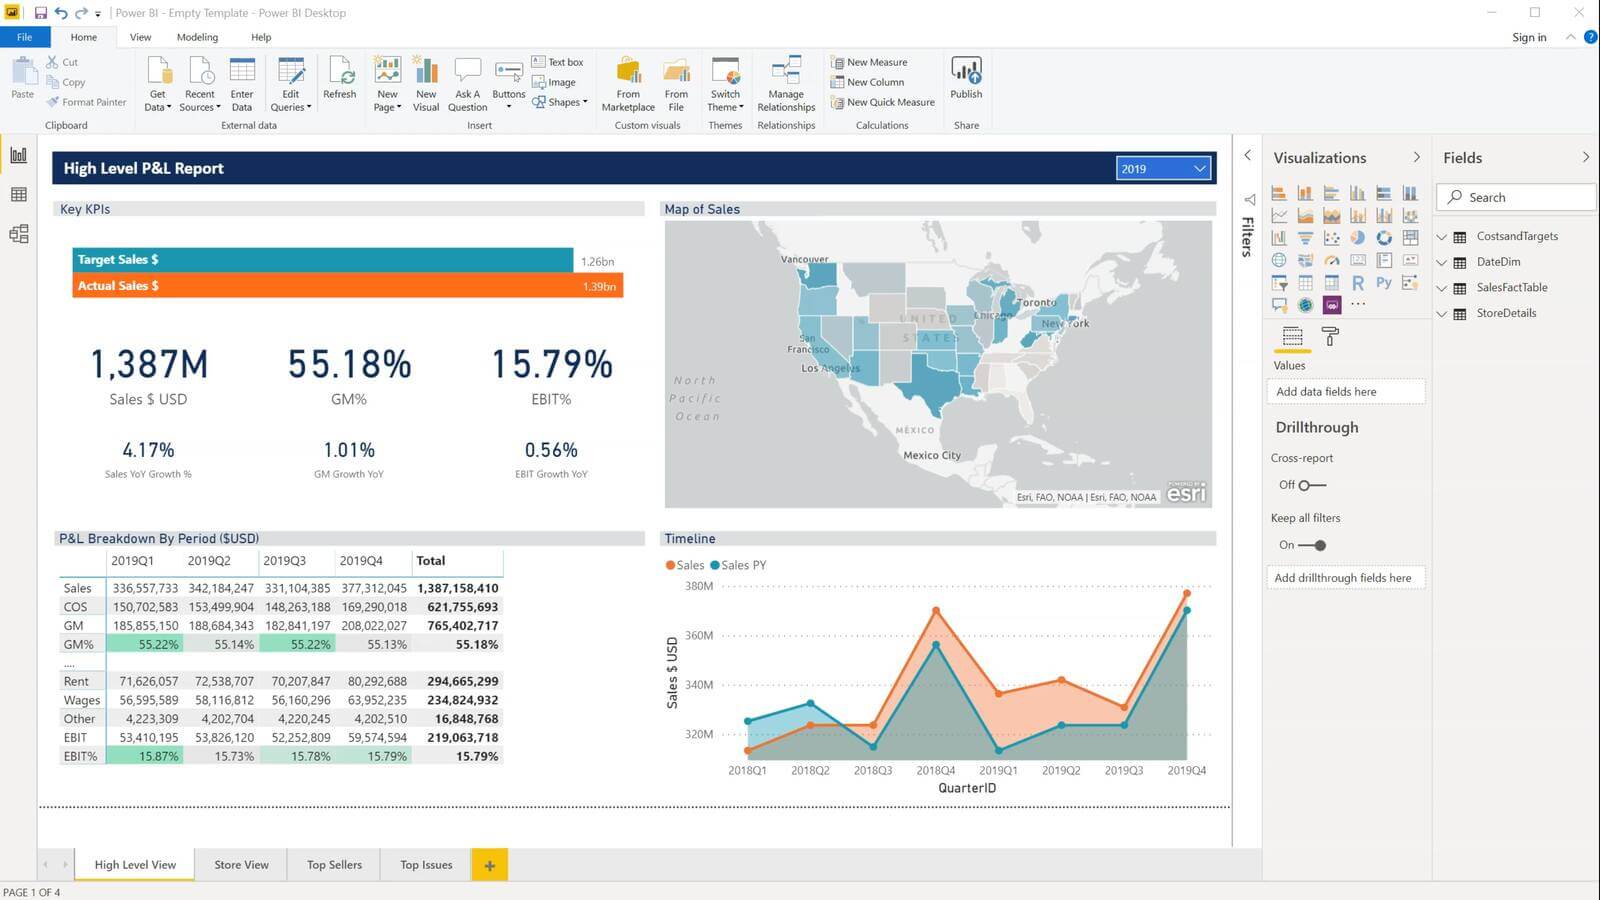
In order to begin analysis, analysts will start by aggregating data into a single place, referred to as a data model. With this set of connected data, analysts can create metrics and visuals that help dissect an issue and present conclusions or root causes.
Visualizations can be in the form of tables, or in the form of charts, graphs, histograms, or other visual representations, along with BI dashboards and reports. Often these dashboards are interactive, allowing stakeholders to interact with reports and drill down into problems.
This means setting standards and benchmarks, creating useful dashboards that visualize and contextualize data-driven insights, and monitoring key performance indicators (KPIs). Essentially, reporting is all about getting the insights from the analysts to the decision makers who will use those insights in the next step.
This step is ultimately where the business benefits from BI. After digesting reports, decision-makers will make business decisions based on what they’ve learned.
Taking action could mean expanding into a new market, rethinking an element of the business strategy, rethinking a product assortment, or even confirming that the current strategy is good. What’s important is that the insights transform from an idea into a reality.
Finally, stakeholders will collaborate to determine what worked, what didn’t, and how to improve. This can take the form of using a different visualization method to present insights. It could mean analyzing different data. It could even be an entire reevaluation of the BI team’s objectives, such as a reformulation of what questions that we’re trying to answer.
This iteration then feeds back into the first step, requirements gathering, to bring us back to the beginning of the business intelligence cycle. We’ll take the lessons learned from the entire movement through the cycle, identify spots to improve, and move forward from there. As we progress through sequential iterations of the entire process, our BI will gain strength, the insights will become more valuable, and the resulting actions will become even more impactful.
The discipline of business intelligence is constantly evolving. While it remains fixed in its goal of generating actionable insights, the technologies that we use to get there are always changing and improving. This is especially true for modern-day BI processes that incorporate real-time big data analytics alongside existing historical data analysis.
Since tools change fast, the BI cycle has to respond accordingly, with reports and dashboards often being upgraded as new data or new technology allows.
Businesses now have an unparalleled look into their performance, their industries, and their markets at large. If you’re ready to join them and take your career to the next level, becoming a business intelligence professional is a smart move. Get started with our Introduction to Business Intelligence course now!
Connect what you just learned to a clear career path with CFI’s role‑based courses and certification programs.
What is Business Intelligence?


