Get Certified for
Business Intelligence (BIDA®)
Develop analytical superpowers by learning how to use programming and data analytics tools such as VBA, Python, Tableau, Power BI, Power Query, and more.
Steps to create a PowerPoint presentation from scratch
A PowerPoint presentation is a very powerful tool to convey information to an audience. It is often used in lectures and business meetings as it provides visualized messages. Here are the basic steps for beginners to create a PowerPoint presentation from scratch.
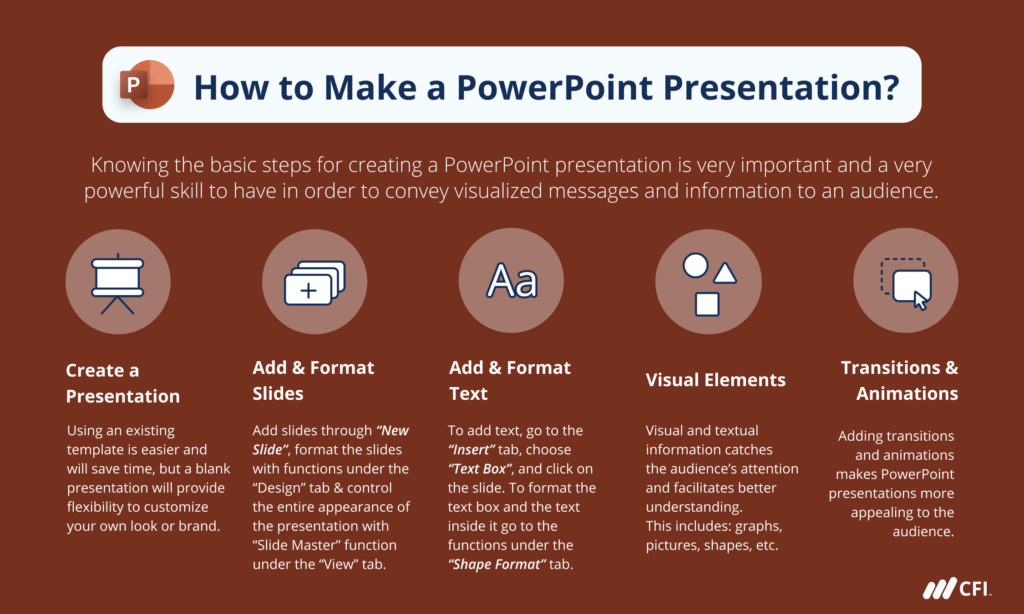
When opening PowerPoint, it provides options to create a blank presentation or to utilize a preset template. Using an existing template is much easier and will save time, but a blank presentation provides more flexibility to customize your own look or develop your own brand.
Before creating the presentation, you should check for any template or format requirements from the task you are working on, especially for business projects. Many companies create their own branded templates for consistency purposes.
After creating the presentation, you add slides through the “New Slide” button under “Home” or right-clicking the navigation panel. It provides different slide structures for titles, content, and images, which helps to save a lot of time from structuring your own slides.
You can format the slides through the functions under the “Design” tab. It provides a few themes to make the slide more visually appealing. You can also customize the slide size and background according to specific needs.
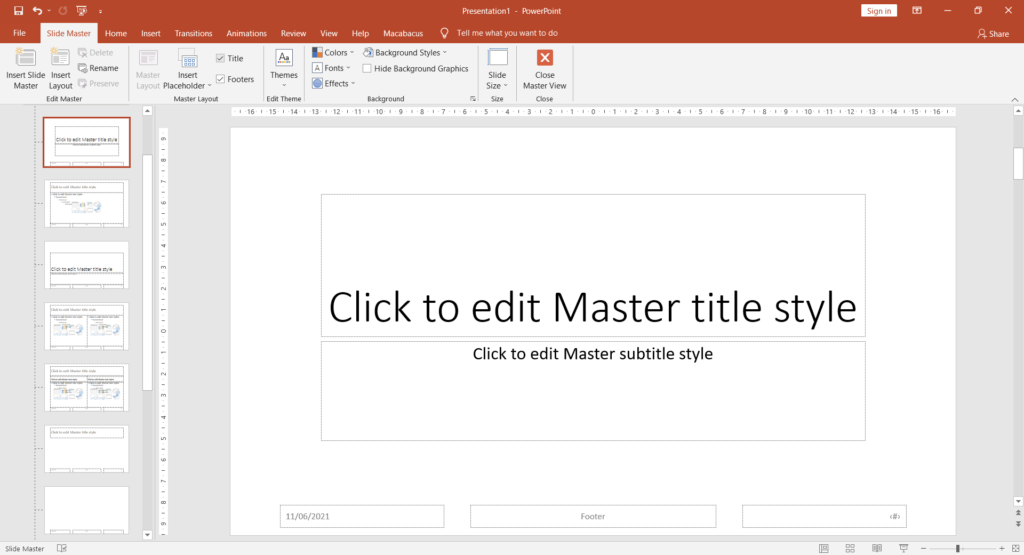
The “Slide Master” function under the “View” tab controls the appearance of the entire presentation. The logo, image, or text inserted in the master slide will show up on every slide, ensuring consistency of the format across the presentation.
New slides added to the presentation typically contain several text boxes for title and content, where you can type in the text directly. If you would like to insert additional textboxes or start with a blank slide, you can go to the “Insert” tab, choose “Text Box,” and click where you want to put the text on the slide.
You can format the text box and the text inside it through the functions under the “Shape Format” tab. For example, you can change the fill and outline of the text box, or the font, color, and size of the text.
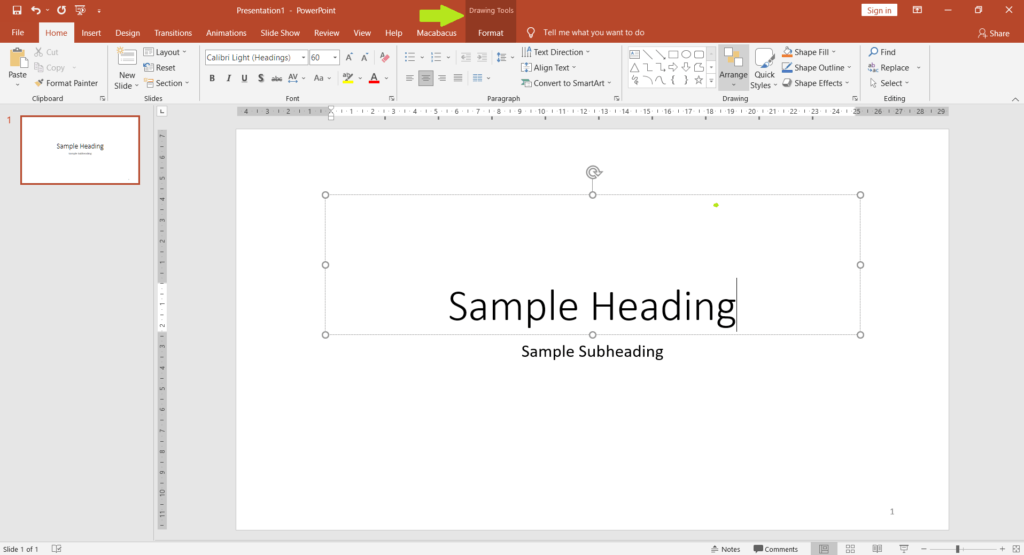
Notice here that when you choose the text box, the text formatting will be applied to all the text inside it. If you only want to change the format of a couple of words or sentences, you will need to highlight the words you would like to format instead of clicking on the entire box.
It is usually suggested to use the same font across the presentation and use different font sizes and font styles (bold or underscore) to differentiate the titles and subtitles from the content. This helps to keep your slide formats consistent.
One of the biggest advantages of a PowerPoint presentation is its effective incorporation of visual and textual information, which keeps the audience’s attention and facilitates better understanding. You can insert screenshots, pictures, tables, charts, and shapes into slides.
Excel charts are one of the most frequently used types to present data analysis results. You can develop the chart in an Excel file and then copy and paste it into the PowerPoint presentation.
Several paste options are available to the user, e.g., as a picture in PNG, JPEG, or GIF, as an Excel chart object, or as a Microsoft graphic object. The picture format does not support further edits on the chart, leading to extra steps if the data or chart needs to be changed later.
If you paste content as a chart object, the chart will show up as a fixed picture, but it contains a link to the embedded workbook. By double-clicking the pasted chart, it will open the Excel workbook that the chart originated from so that you can refer to the data or edit the chart through Excel.
By choosing the graphic object format, you will be able to edit the pasted chart on PowerPoint directly, such as adding or deleting chart elements, editing text formats of the title and labels, or changing the color of the lines and shapes. However, you are not able to change the data reference through PowerPoint directly.
Similar to pasting Excel tables, you can choose to paste a table as a picture or retain the table nature but choose to keep the table format or not. The choice of pasting format depends on specific needs and personal preferences.
By following the instructions above, you will be able to develop a decent PowerPoint presentation now, but you can also add more color to your presentation through some animation effects.
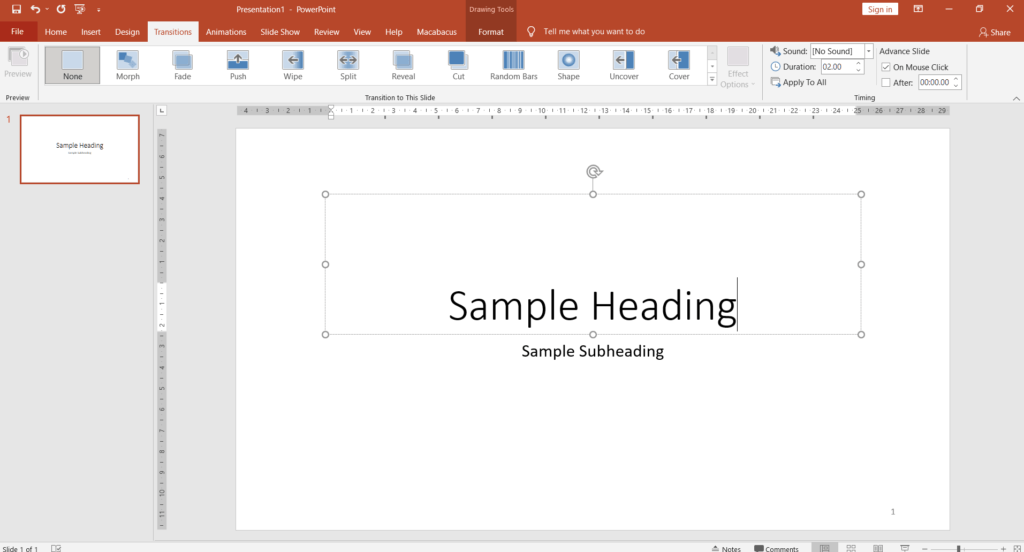
Adding transitions and animations makes PowerPoint presentations more appealing to the audience. Transitions are applied when switching from one slide to another, while animations are applied to individual elements such as text boxes, shapes, images, etc.
After adding the transition or animation, you will be able to set the start time, duration, and order of the effects.
Connect what you just learned to a clear career path with CFI’s role‑based courses and certification programs.
CFI offers the Business Intelligence & Data Analyst (BIDA)® certification program for those looking to take their careers to the next level. To keep learning and advance your career, the following resources will be helpful:


