Get Certified for
Capital Markets (CMSA®)
From equities and fixed income to derivatives, the CMSA certification bridges the gap from where you are now to where you want to be — a world-class capital markets analyst.
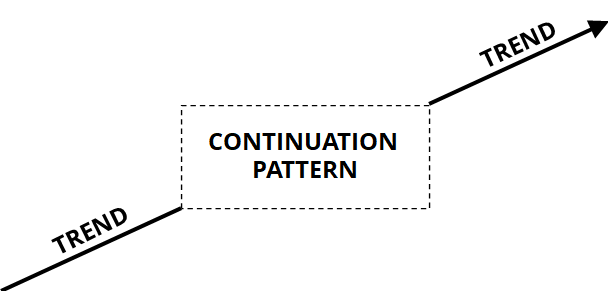
A pattern that forms within a trend that generally signals a trend continuation
A continuation pattern, commonly referenced in technical analysis, is a pattern that forms within a trend that generally signals a trend continuation. In contrast to reversal patterns, continuation patterns signal a temporary consolidation in the middle of a trend.
Continuation patterns may be identified on all time frames, with the most common continuation patterns being:
Each continuation pattern mentioned above is introduced below.
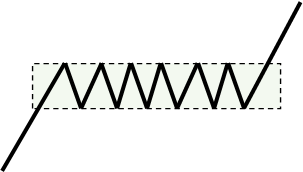
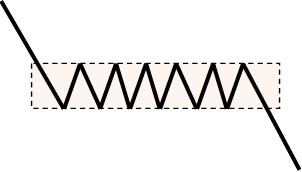
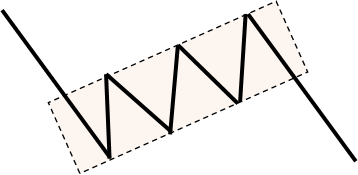
A rectangle continuation pattern is the most easily identifiable continuation pattern and is identified by price action that is bounded by parallel support and resistance lines. Rectangles are also referred to as trading ranges or consolidation zones and can be bullish or bearish.
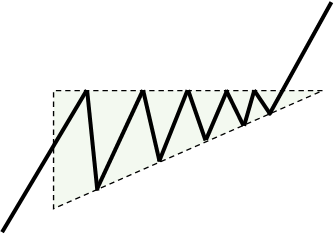
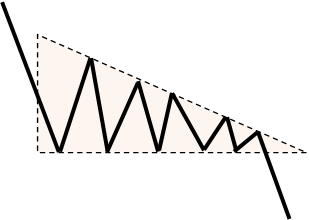
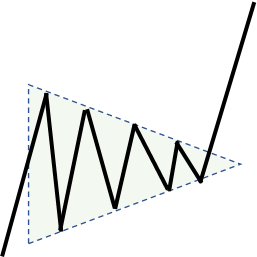
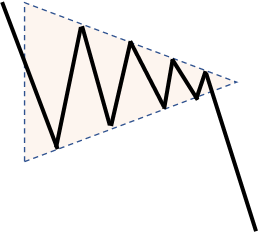
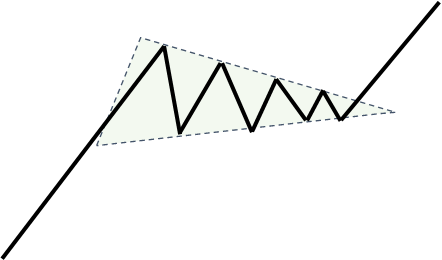
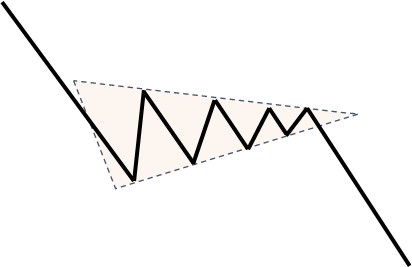
A triangle continuation pattern is identified by price action that moves into a tighter and tighter range. The three types of triangles are:
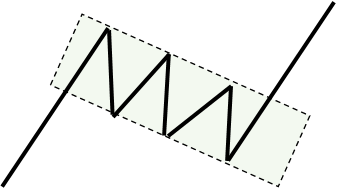
A flag continuation pattern is identified by price action that moves between two parallel trendlines that slope up (bearish flag) or down (bullish flag). As shown below, a flag pattern visually resembles a “flag on a flagpole.”
A pennant continuation pattern is similar to a triangle in that the price action moves between two converging trendlines. A key difference between pennants and triangles is the time frame – pennants tend to form on a shorter time frame.
A general rule is that if a pennant continuation pattern contains more than 20 bars/candlesticks, it is considered a triangle.
Another difference used by technical analysts to differentiate between a pennant and a triangle is the appearance of a flagpole in the initial trend, which is not present in a triangle. Pennants can be bullish or bearish.
Understanding continuation patterns and creating a trading plan based on such patterns are crucial to the success of a technical analyst. Below is an example of how an analyst can use their knowledge of pennant continuation patterns to execute a potentially successful trade:
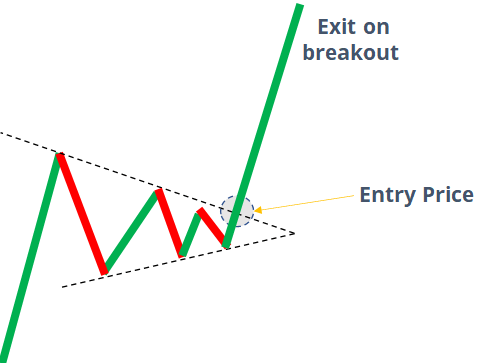
If an analyst believes a pennant pattern is forming, a trading plan could be to:
Continuation patterns can be used on varying time frames, such as hourly, daily, weekly, etc. With that said, such types of patterns tend to be most popularly used in shorter time frames.
A key thing to realize with continuation patterns is that they are not always reliable – trend reversals and false breakouts can occur. As a result, when trading based on continuation patterns, it is important to consider stop losses.
Lastly, patterns are subjective and up to the interpretation of the analyst. One analyst may see a different pattern compared to another analyst, depending on how the pattern is drawn or the time frame.
Connect what you just learned to a clear career path with CFI’s role‑based courses and certification programs.
Thank you for reading CFI’s guide to Continuation Patterns. To keep learning and developing your knowledge, we highly recommend the additional resources below:


