Get Certified for
Capital Markets (CMSA®)
From equities and fixed income to derivatives, the CMSA certification bridges the gap from where you are now to where you want to be — a world-class capital markets analyst.
A candlestick pattern in technical analysis that is a bearish reversal signal
The dark cloud cover refers to a candlestick pattern in technical analysis that is a bearish reversal signal. It is observed when a “down” candle opens above the close of the previous “up” candle and proceeds to close below the midpoint of the “up” candle within a candlestick chart.
The dark cloud cover is a pattern or single that is observed within technical analysis. Technical analysis is a discipline that is applied by security traders who observe patterns within historical trading data and attempt to analyze securities with this data. Generally, technical analysis traders will observe charts that give information about the price movement or trading volume of securities to draw insights on future price movements.
Clearly, technical analysis is more of a short-term trading discipline that does not involve long-term fundamental analysis of individual securities. Instead, technical analysis will focus on short-term trading signals that can evaluate a security’s investment attractiveness based on a comparison between that security’s charts and patterns against the charts and patterns of its own history or other securities.
Technical analysis can be used for any security with historical pricing data. It includes asset classes such as:
However, technical analysis is more commonly used in price-driven securities, such as commodities and currency markets.
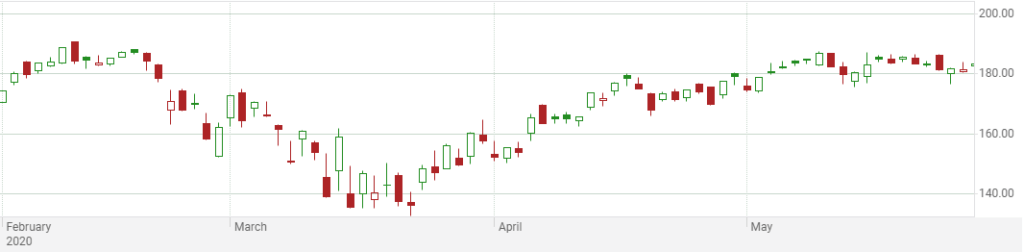
The dark cloud cover refers to a candlestick pattern that serves as a bear signal, which indicates that a persisting uptrend may reverse into an upcoming downtrend. Candlestick charts are price charts that are prevalent within technical analysis. They display the high, low, open, and closing prices of a given security over a period of time. Below is an example of a candlestick chart for Microsoft’s common stock (NASDAQ:MSFT) in 2020.
The green/white candlesticks show stronger buying pressures, while a red/black candlestick shows stronger selling pressures.
As mentioned earlier, the dark cloud cover is a pattern where the down candle opens above the close of the up candle and then closes below the midpoint of the up candle. If the price continues to trend lower by the third candle, then this is known as the confirmation. The confirmation is an additional indicator that suggests that a trend may be occurring.
Dark cloud cover patterns are taken seriously when occurring after a significant uptrend in prices for a security. The pattern is used to indicate when the uptrend will end and will shift into a downtrend. There are three stages of the dark cloud cover pattern:
Traders may use the dark cloud cover to inform their selling decisions. A trader can potentially exit a long position upon observing a dark cloud cover pattern. Or, the trader may pay more attention to a security that has exhibited such a pattern and wait for confirmation on whether to exit that position. If other “bear” patterns are observed, a trader may potentially wish to short that security as well.
The dark cloud cover is usually used to supplement other technical analysis methods. Common technical analysis indicators used are:
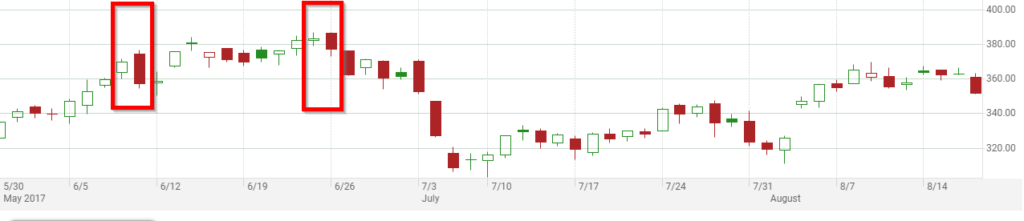
Here is an example of a candlestick chart for Tesla (NASDAQ:TSLA) – a notoriously volatile stock. There are two clear observations of a dark cloud cover here:
The signal could indicate to traders to exit their long positions of Tesla’s stock or to enter short positions at such points as well. Traders commonly use stop-loss order instructions to limit their potential losses in case the trend reverses again.
CFI is the official provider of the Capital Markets & Securities Analyst (CMSA®) certification program, designed to transform anyone into a world-class financial analyst.
In order to help you become a world-class financial analyst and advance your career to your fullest potential, these additional resources will be very helpful:


