Get Certified for
Capital Markets (CMSA®)
From equities and fixed income to derivatives, the CMSA certification bridges the gap from where you are now to where you want to be — a world-class capital markets analyst.
A momentum technical indicator that aims to measure the trend in prices and identify trend reversals
The fast stochastic indicator (%K) is a momentum technical indicator that aims to measure the trend in prices and identify trend reversals. The indicator was developed by securities trader and technical analyst George Lane.
The indicator is driven by two parameters: the lookback period and the smoothing parameter. The lookback period is the period over which the oscillator is calculated. The smoothing parameter is the number of periods over which the moving average of the oscillator is calculated. It is called an oscillator because the value of the indicator oscillates between 0 and 100. It can be computed as follows:
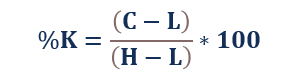
Where:
The lookback period is usually 5 days or 14 days, but it can be any number between 5 days and 21 days. The indicator is not effective over longer periods because, over longer periods, stock prices tend to assume an upward trend.
There is also a second quantity computed known as %D, which is the 3-day SMA of the %K. It is a smoothed version of the %K. It is computed because %K is a volatile indicator and can lead to spurious signals. A smoothed version (%D) moves much slower than the %K; hence the signals generated indicate a stronger trend.
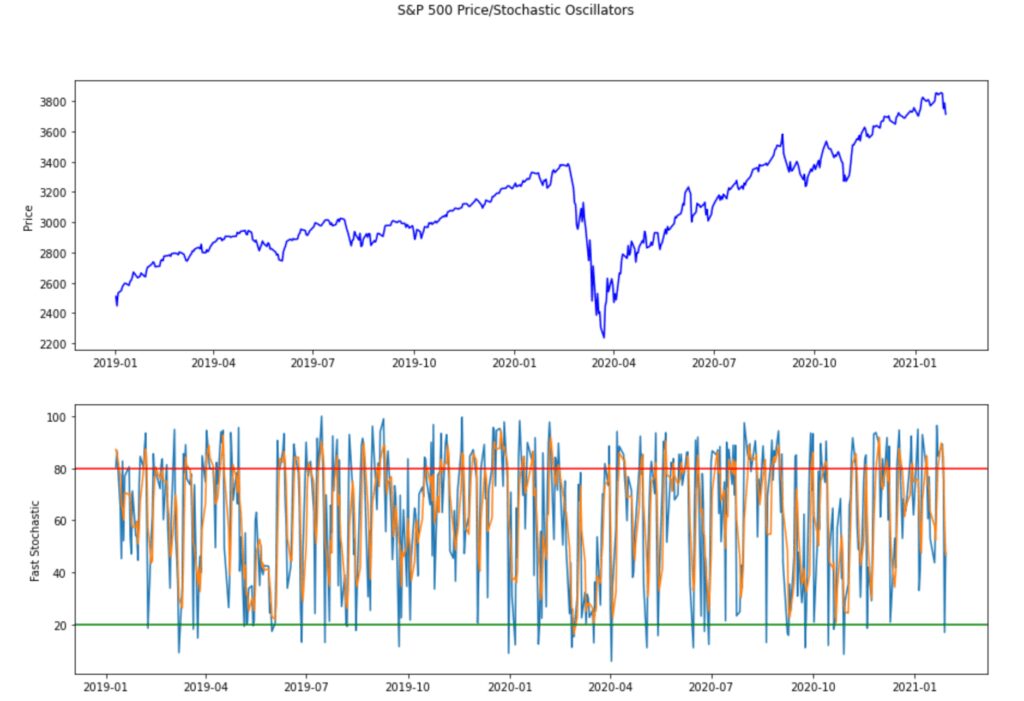
The fast stochastic oscillator (%K) is a momentum indicator, and it is used to identify the strength of trends in price movements. It can be used to generate overbought and oversold signals. Typically, a stock is considered overbought if the %K is above 80 and oversold if %K is below 20. Other widely used levels are 75 and 25, respectively.
The above levels may be used as buy (%K below 20) or sell (%K above 80) to create a simple mechanical trading strategy. In practice, the thresholds are used in combination with other indicators and serve as warning signals.
George Lane, the indicator’s creator, suggests the following strategy. Treat the overbought and oversold thresholds as preconditions. Once the indicators hit such levels, the trader must look for a divergence. A divergence is when the price moves in a different direction from the indicator. There are two types of divergences, bull divergence and bear divergence.
The bull divergence is used to identify buy signals. When the stochastic oscillator falls below 20, the trader should look for two further conditions. First, the trader should check if the %K has fallen below %D, then see if there is a divergence in the movement of %K and the stock price.
If the stock price has fallen further, but the %K rises, then it is a reversal in the trend. According to the stochastic oscillator analysis, it is a buy signal, and the trader should place a buy order. The stock is sold when the oscillator crosses 80, and a sell signal is generated.
The bear divergence is used to identify sell signals. When the stochastic indicator rises above 80, it is the precondition to search for the bear divergence. A bear divergence occurs when the %K is above %D.
Further, the stock price makes a high while the oscillator (%K) falls. It indicates a weakness in the uptrend and that the price may begin to fall. According to stochastic oscillator analysis, it is a sell signal, and the trader should place a sell order. The stock is repurchased when the next buy signal is generated.
The above system can also be used for a long-short framework, where, instead of just selling the stock, the trader can actively short the stock when a sell signal is generated by the indicator. It is a riskier strategy but can be used as a trend-following strategy for hedging tail risk.
Download our free Stochastic Oscillator Excel template, and start modeling today!
The slow stochastic indicator can be easily computed using MS Excel. The following is a short tutorial on how to calculate the indicator.
Step 1: Collect the daily closing prices of the index or the stock to study.
Step 2: Calculate the Fast Stochastic Oscillator over the desired lookback period (5-21 days). Use the MIN() and MAX() functions to calculate the low price (L) and high price (H), respectively. Compute the Fast %K using the above formula. (See below)
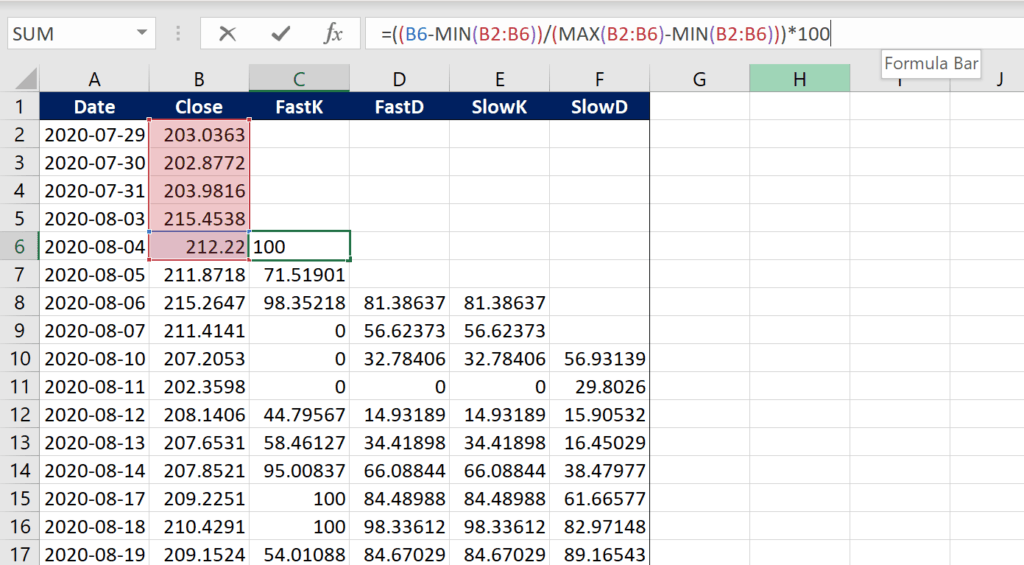
Step 3: Compute the 3-day simple moving average of the Fast Stochastic Oscillator (Fast %K) to get the %D (equivalent to the Slow %K).
A simple trading strategy using the fast stochastic indicator can be executed as follows:
The stochastic indicator generates buy and sell signals. The signals can be used to create a dedicated long or short strategy, as well as a long-short strategy. In our strategy, the buy signal is generated when the %K falls below 20, and a sell signal is triggered when the %K rises above 80.
The strategy is a long-short strategy. When the buy signal is triggered, the strategy is long the S&P 500 Index with a 100% weight. On the other hand, when a sell signal is generated, the strategy is short the S&P 500 Index with a negative 50% weight.
The result of following the above strategy is summarized below:
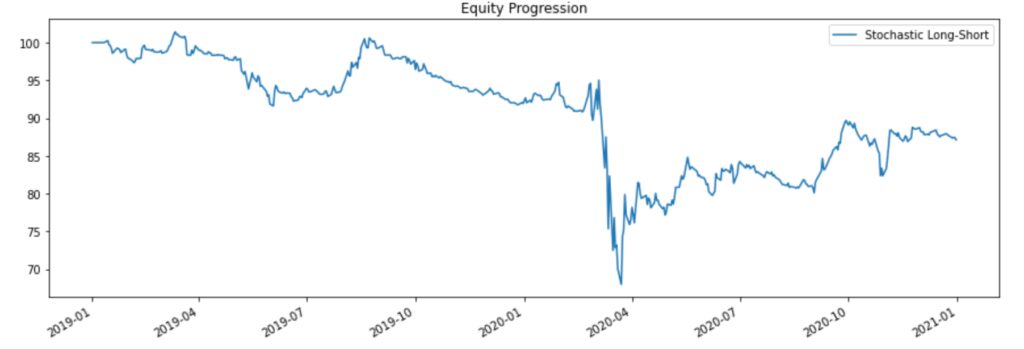
The total return for the strategy over the backtest period is -15%, compared to a simple buy and hold for the S&P 500 Index over the same period, which would’ve returned close to 50%. It is an unprofitable strategy in the long run, but the chart reveals something interesting. The short portion of the strategy is effective at making money during a drawdown. It is further supported by the fact the indicator generates more sell signals than by signals. (See Figure 4 below).
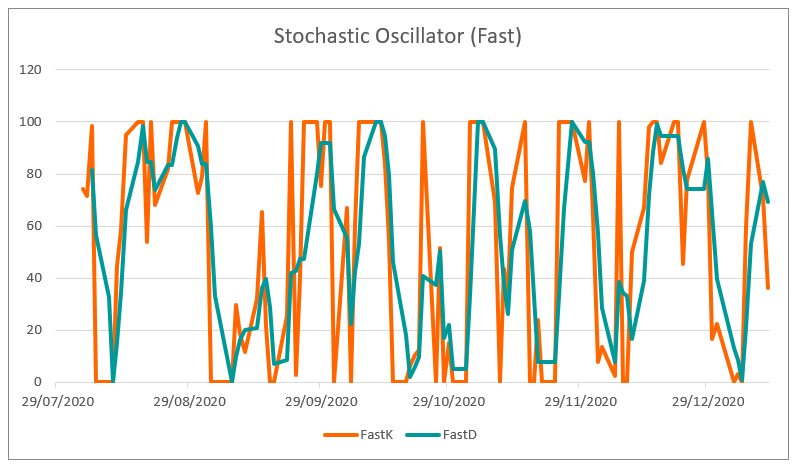
The fast stochastic indicator is much more volatile than the slow indicator. It generates many more buy and sell signals than the slow indicator. If followed naively, the choppiness of the fast indicator can lead to increased transaction costs due to the many trading signals. The signals generated may not be as strong, and there might be losses due to an incorrect decision.
The fast indicator is also more prone to being stuck at the extremes of 0 and 100 for longer periods of time than the slow indicator. Hence, the slow stochastic indicator was developed to overcome the high volatility of the fast indicator.
To keep learning and advance your career, the following resources will be helpful:


