Get Certified for
Capital Markets (CMSA®)
From equities and fixed income to derivatives, the CMSA certification bridges the gap from where you are now to where you want to be — a world-class capital markets analyst.
When the price of a security or other treaded financial asset moves in a specific direction and then quickly reverses
A head-fake trade occurs when the price of a security or other traded financial asset moves in a specific direction and then quickly reverses to follow the opposite direction. The term “head-fake” is common in sports (particularly football and basketball) and derived from a tactic used by teams in sports to confuse opposing teams by making them believe that players are moving in a particular direction but then take on another direction.
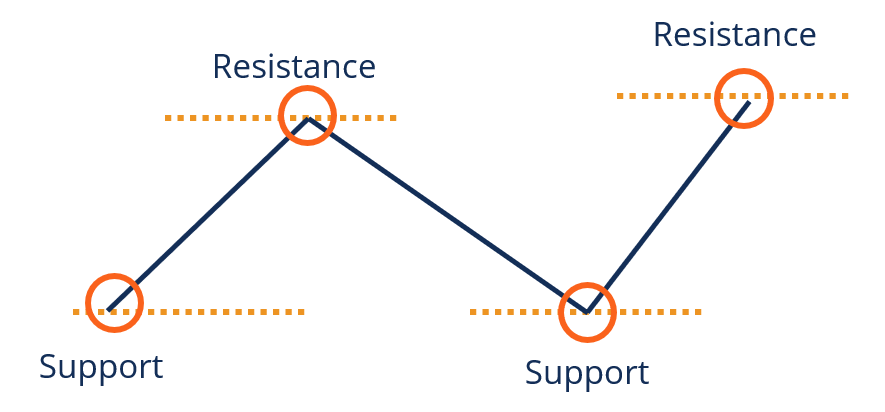
Head-fake trades tend to occur at break-out points – such as support and resistance levels – and the break-out points can be monitored in conjunction with simple moving averages.

Consider a scenario where the economy and overall market see a decline in performance, but there is an asset that is trading at high price points. Traders who are interested in selling off the traded asset will vigilantly monitor the changes in the price of the asset and try to identify potential break-out points and measure whether the increment will break down.
If the price increment of the traded asset begins to slow down or notably decrease, players in the market may follow the assumption that the asset’s price has begun declining and rush to sell off the asset; however, if the price direction reverses – i.e., begins to rise again – the scenario would be considered a head-fake trade.
There are a few people who aim to generate profits from head-fake trades. Such contrarians tend to buy a financial asset or stock when other market players are looking to sell or vice-versa. Hence, they do not follow universal market opinions. Losses can be incurred due to head-fake trades; thus, traders should always set up and adhere to stop-loss limits to minimize their risk exposure.
Financial traders use support and resistance levels to analyze and identify chart patterns in the market.
A support level occurs at a price level where a downward trend comes to a halt due to a rise in demand from the buyers in a market. The support level is said to support the price of a trade financial asset and prevents prices from dropping further below the support level.
A resistance level occurs at a price level where an upward trend comes to a halt due to an increase in supply from sellers in a market. The resistance level is said to give resistance to the price of a trade financial asset and prevents prices from moving up above the resistance level.
The simple moving average (SMA) is an arithmetic computation of the average of a range of values (usually prices) by adding the most recent values together and dividing the sum figure by the number of periods in the range.
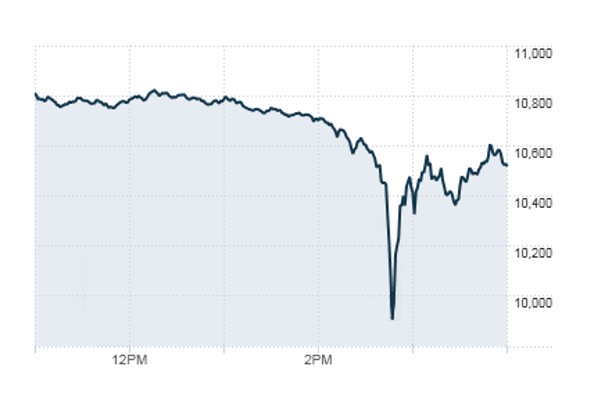
In 2010, the crash of 2:45 (also known as the flash crash) occurred and resulted in losses that amounted to trillions of dollars. The stock market crash lasted 36 minutes.
During the flash crash, stock index prices fell considerably and then rose again in a matter of minutes. The market was able to regain losses incurred as prices recovered. The indices impacted include the NASDAQ Composite, the S&P 500, and the Dow Jones Industrial Average.
The prices of various traded assets were highly volatile during the crash, which brought about an increase in trading volumes. Traders who took sell positions, following the assumption that the short-term downward trend would persist, incurred losses as the price direction changed and prices began to increase.
The image below shows a snapshot of the Dow Jones Industrial Average (DJIA) on May 6, 2010.
CFI is the official provider of the Capital Markets & Securities Analyst (CMSA)™ certification program, designed to transform anyone into a world-class financial analyst.
In order to help you become a world-class financial analyst and advance your career to your fullest potential, these additional resources will be very helpful:


