Get Certified for
Capital Markets (CMSA®)
From equities and fixed income to derivatives, the CMSA certification bridges the gap from where you are now to where you want to be — a world-class capital markets analyst.
Moving Average Convergence Divergence
The Moving Average Convergence Divergence (MACD) oscillator is one of the most popular and widely used technical analysis indicators that traders and analysts use to gauge momentum in markets.
Traders and analysts use a variety of technical indicators to spot trends in the market, anticipate potential shifts in trading, and, ultimately to either trade successfully themselves or to offer advice to clients so that they may trade successfully.
The popularity of the MACD indicator can be directly linked to its ability to calculate and indicate rapid short-term momentum increases or decreases.
Gerald Appel developed the Moving Average Convergence Divergence in the latter part of the seventies. While the name seems long and complicated, it is one of the least complicated indicators to actually calculate and put practically into application.
The Moving Average Convergence Divergence utilizes two different trend tracking indicators – moving averages – and creates a momentum oscillator from them by subtracting the moving average of the longer time period from the moving average of the shorter time period. In a sense, this makes the MACD a double-edged technical indicator in that it offers traders and analysts the ability to follow trends in the market, as well as to gauge the momentum of price changes.
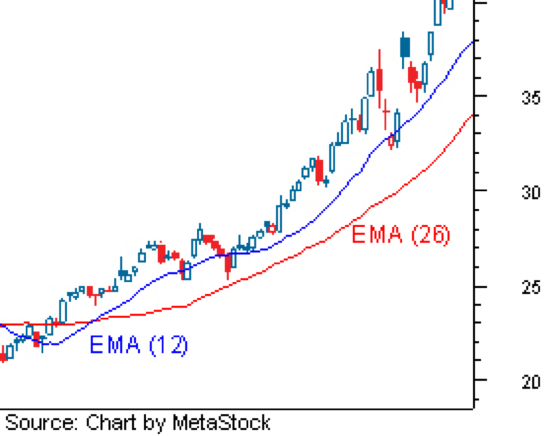
The calculated moving averages will inevitably converge, cross over one another, and then proceed to diverge, or move away from each other, making the MACD jump over and under the zero line as this happens. Traders are then able to watch for these signaling crossovers and divergences in order to help them spot changing market trends, either bullish or bearish. Sometimes explaining the MACD with words gets confusing. Take a look at the picture below.
Learn more at https://www.metastock.com/
Access our free MACD Excel template, start practicing your modeling skills today!
The picture above clearly illustrates how shorter-term and longer-term moving averages come closer together (converge), move further apart (diverge), and cross over one another. The MACD reflects the changing relationship of short-term exponential moving averages to long-term exponential moving averages.
The equation used to calculate the MACD is as follows:
Traders and analysts typically use closing prices for 12-day and 26-day time periods to generate the EMAs used to calculate the Moving Average Convergence Divergence. Following this, a 9-day moving average for the MACD line itself is then plotted alongside the indicator to serve as the signaling line that will help illuminate when a market may be turning.
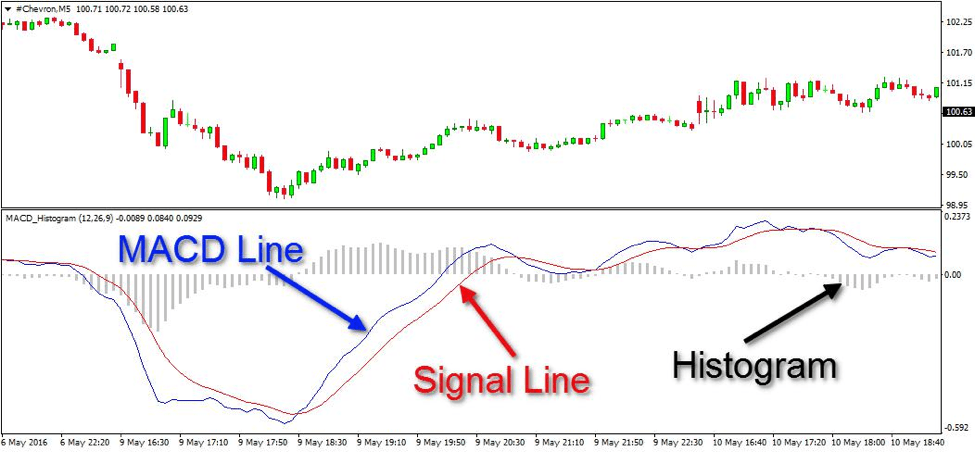
The picture above clearly indicates the Moving Average Convergence Divergence line, the signaling line, as well as the MACD histogram, which is a representation of the difference between the 9-day moving average and the MACD. When the MACD Oscillator line crosses above the 9-day average (signaling line), the histogram reads as positive (above the zero line indicated on the right-hand side of the MACD window). Conversely, the histogram is negative when the MACD dips below the signaling line.
As we mentioned earlier, 12-period and 26-period values are the generally used settings to calculate the MACD. Changes in the time periods used for calculation can be made to accommodate a trader’s specific trade goals or their particular style of trading.
As we’ve already covered, the MACD is built on movement – the movement of moving averages either towards one another (convergence) or away from one another (divergence). The Moving Average Convergence Divergence indicator fluctuates, or oscillates, over and under the zero line, otherwise known as the centerline. This fluctuation is a crossover which signals to traders that the shorter moving average has crossed the path of the longer one.
The MACD is seen as positive when the 12-day moving average crosses above the 26-day average. As the shorter-term moving average diverges and moves further and further from the longer-term one, the positive values of the Moving Average Convergence Divergence increase. This is an indication that upside momentum is rising. With this in mind, it’s not a stretch to understand that when the opposite happens, the 12-day average dips below the 26-day average, the Oscillator turns negative, and as the shorter-term moving average moves further downward away from the longer-term moving average, an increase in downside momentum is indicated.
Crossovers of the signal line by the Moving Average Convergence Divergence line are one of the indicator’s staple signals. The signal line, as we’ve covered already, is the 9-day moving average of the MACD line itself. The signal line is an estimated valuation for the movement of the oscillator that makes bullish and bearish MACD turns easier to see.
When a trader sees that the Moving Average Convergence Divergence turns north, crossing over the signal line, and continues or stays above it, a bullish crossover has occurred. This is a signal that a security’s price is on the rise.
The exact opposite is true when the Moving Average Convergence Divergence crosses down over the signal line. This is a bearish crossover and if the Oscillator continues to drop below the signal line, it’s a good indication that the bears are taking over. Depending on the steepness of the drop and the number of days the drop continues, many traders may prefer to sell before they lose a significant amount of value. This is also a great time for savvy traders to pick up undervalued securities that are potential gold once a bullish market returns.
The MACD is frequently watched by analysts for signs of divergence from the movement of price. When price continues rising to a new high level but the MACD does not follow suit – instead turning south. This divergence from price action is commonly interpreted as a sign of impending trend change. In fact, many traders use the MACD solely as a possible trend change indicator, always watching for such divergence from price action.
Any time the signal line is crossed over at either extremely high or extremely low points, be cautious before you act. Similarly, if a crossover seems shallow, or seems to move either up or down but then plateaus, be vigilant but don’t make a move in haste. The volatility in an underlying security can be deceptive and cause the MACD to move in unusual ways.
As with anything, putting the MACD into practice and working with it on a regular basis will allow you to get a feel for its common patterns and movements, and will help you sharpen your eye when it comes to extreme or uncommon fluctuations. The longer you work with the Oscillator, the easier it will be to interpret its signals properly and trade successfully.
CFI offers the Capital Markets & Securities Analyst (CMSA)® certification program for those looking to take their careers to the next level. To keep learning and advancing your career, the following resources will be helpful:


