Get Certified for
Capital Markets (CMSA®)
From equities and fixed income to derivatives, the CMSA certification bridges the gap from where you are now to where you want to be — a world-class capital markets analyst.
A Risk-Adjusted Return Ratio
The Treynor Ratio is a portfolio performance measure that adjusts for systematic risk. In contrast to the Sharpe Ratio, which adjusts return with the standard deviation of the portfolio, the Treynor Ratio uses the Portfolio Beta, which is a measure of systematic risk.
These ratios are concerned with the risk and return performance of a portfolio and are a quotient of return divided by risk. The Treynor Ratio is named for Jack Treynor, an American economist known as one of the developers of the Capital Asset Pricing Model.
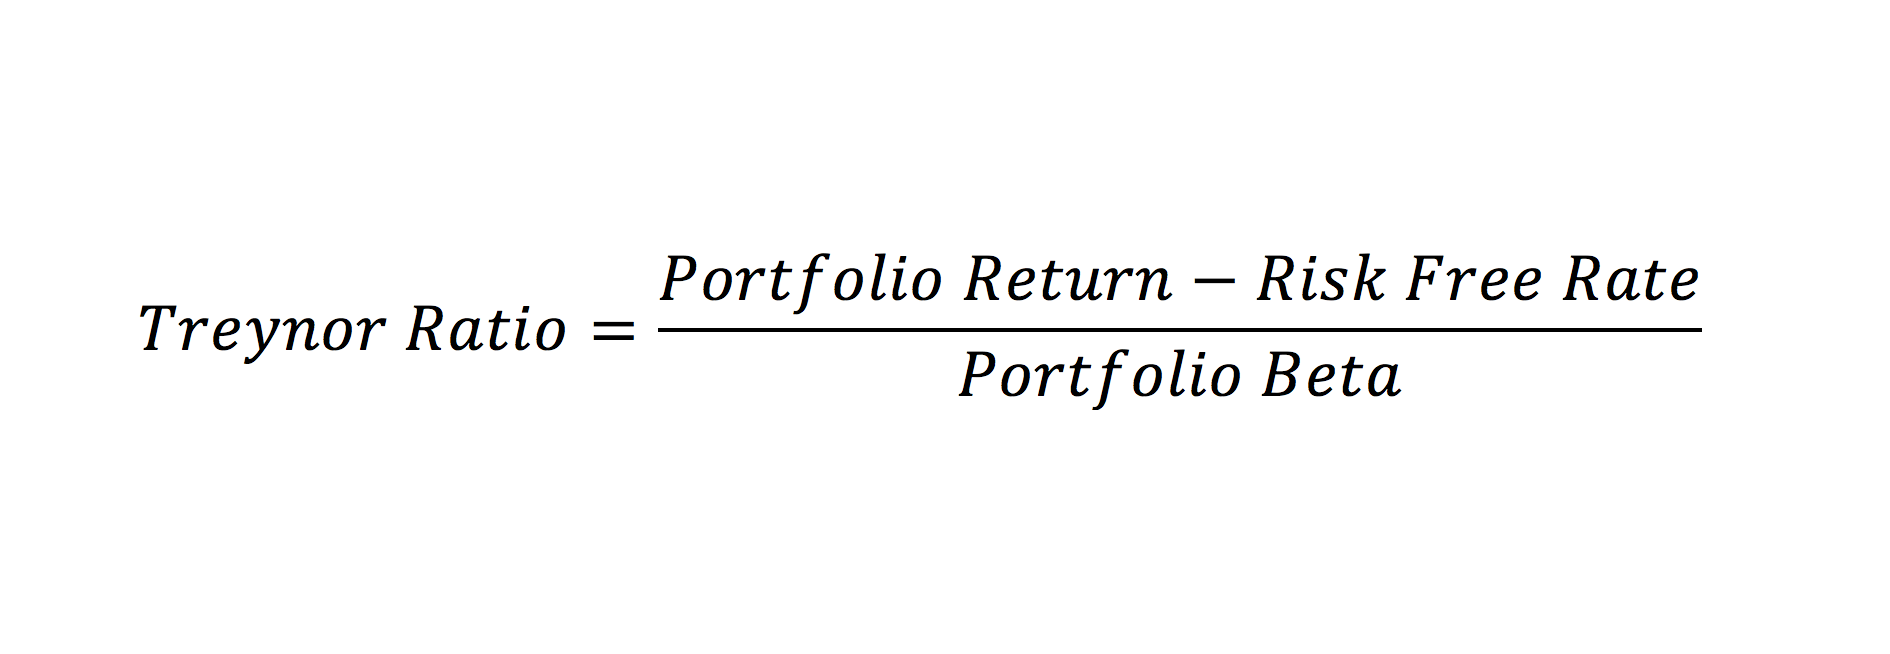
From the formula below, you can see that the ratio is concerned with both the return of the portfolio and its systematic risk. From a purely mathematical perspective, the formula represents the amount of excess return from the risk-free rate per unit of systematic risk. Like the Sharpe Ratio, it is a Return/Risk Ratio.
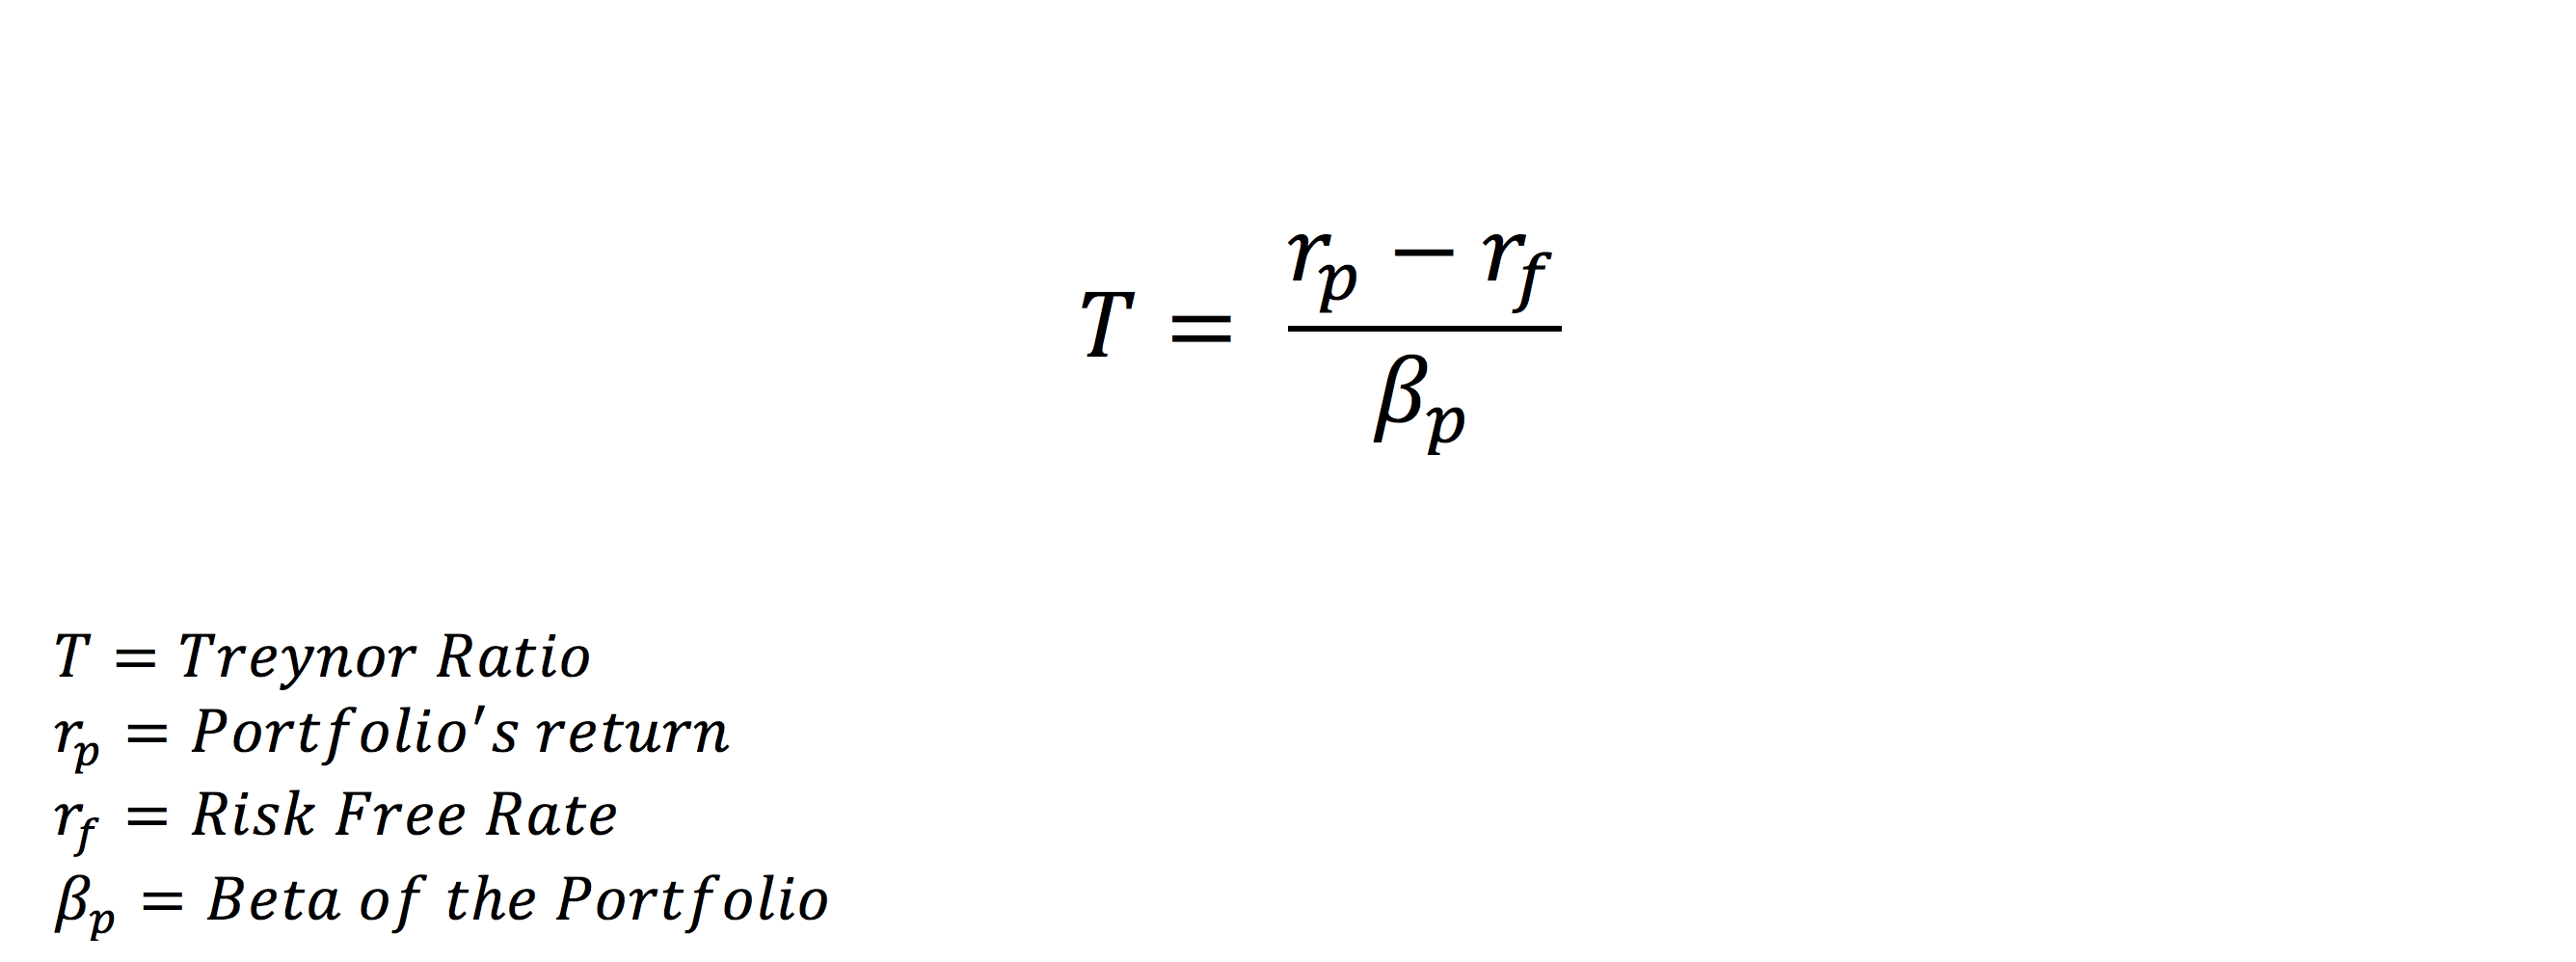
The Treynor Ratio measures portfolio performance and is part of the Capital Asset Pricing Model. To read more about how to calculate Beta, click here.
Suppose you are comparing two portfolios, an Equity Portfolio and a Fixed Income Portfolio. You’ve done extensive research on both portfolios and can’t decide which one is a better investment. You decide to use the Treynor Ratio to help you select the best portfolio investment.
The Equity Portfolio’s total return is 7%, and the Fixed Income Portfolio’s total return is 5%. As a proxy for the risk-free rate, we use the return on U.S Treasury Bills – 2%. Assume that the Beta of the Equity Portfolio is 1.25, and the Fixed Income Portfolio’s Beta is 0.7. From the following information, we compute the Treynor Ratio of each portfolio.
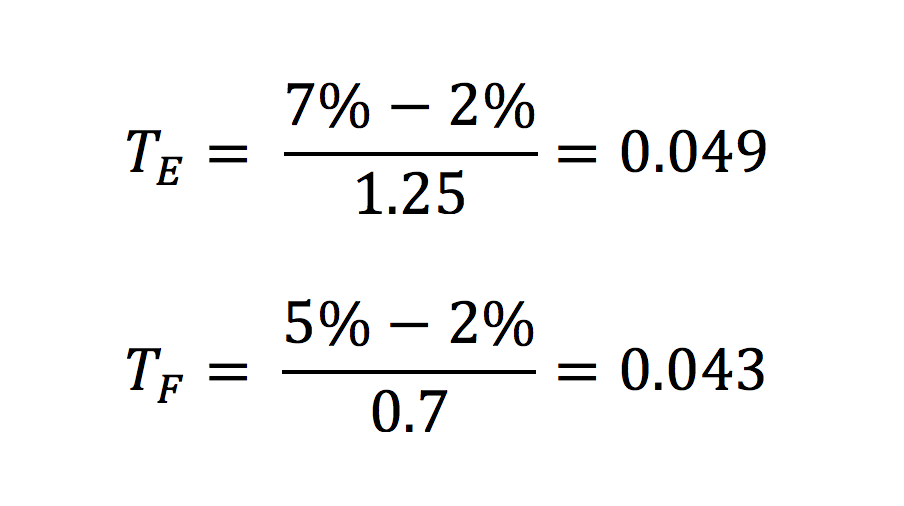
From the results above, we see that the Treynor Ratio of the Equity Portfolio is slightly higher. Thus, we can deduce that it is a more suitable portfolio to invest in. A higher ratio indicates a more favorable risk/return scenario. Keep in mind that Treynor Ratio values are based on past performance that may not be repeated in future performance.
As a financial analyst, it is important to not rely on a single ratio for your investment decisions. Other financial metrics should be considered before making a final decision.
Thank you for reading CFI’s guide on Treynor Ratio. To keep learning and advancing your career, the following CFI resources will be helpful:


