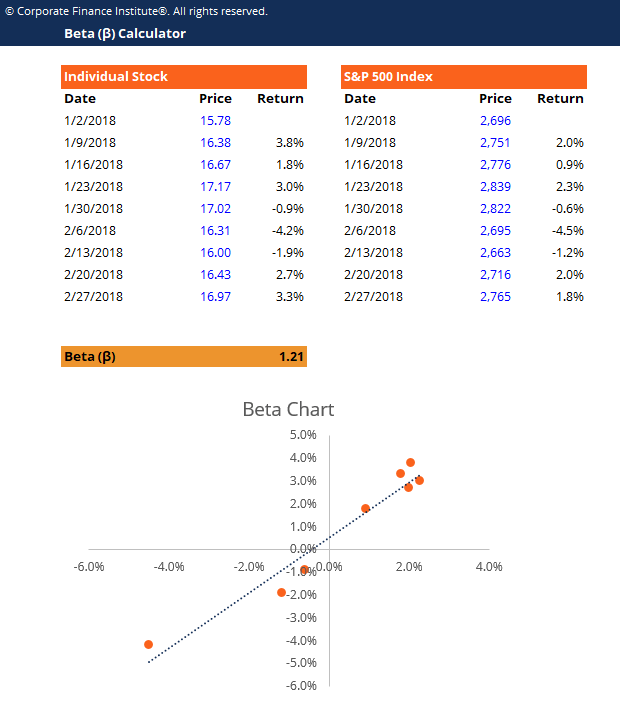
This beta calculator allows you to measure the volatility of returns of an individual stock relative to the entire market.
Below is a screenshot of the beta calculator:
Download the Free Template
Enter your name and email in the form below and download the free template now!
The beta (β) of an investment security (i.e. a stock) is a measurement of its volatility of returns relative to the entire market. It is used as a measure of risk and is an integral part of the Capital Asset Pricing Model (CAPM). A company with a higher beta has greater risk and also greater expected returns.
Follow these steps to calculate β in Excel:
Obtain the weekly prices of the stock
Obtain the weekly prices of the market index (i.e. S&P 500 Index)
Calculate the weekly returns of the stock
Calculate the weekly returns of the market index
Use the Slope function and select the weekly returns of the market and the stock – each as their own series
The output from the Slope function is the β
More Free Templates
For more resources, check out our business templates library to download numerous free Excel modeling, PowerPoint presentation, and Word document templates.